


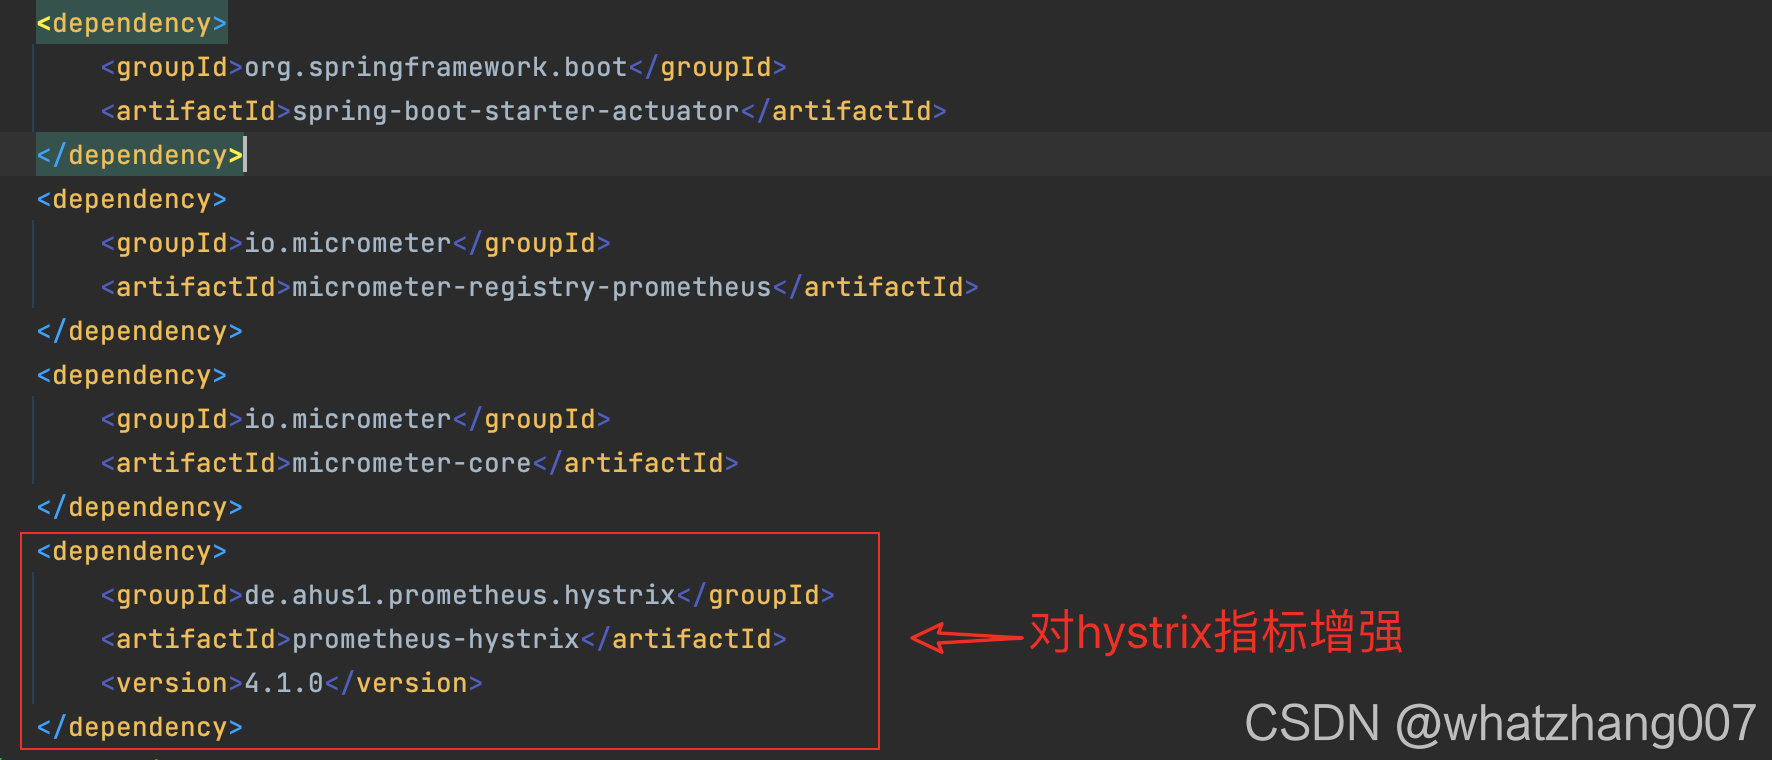
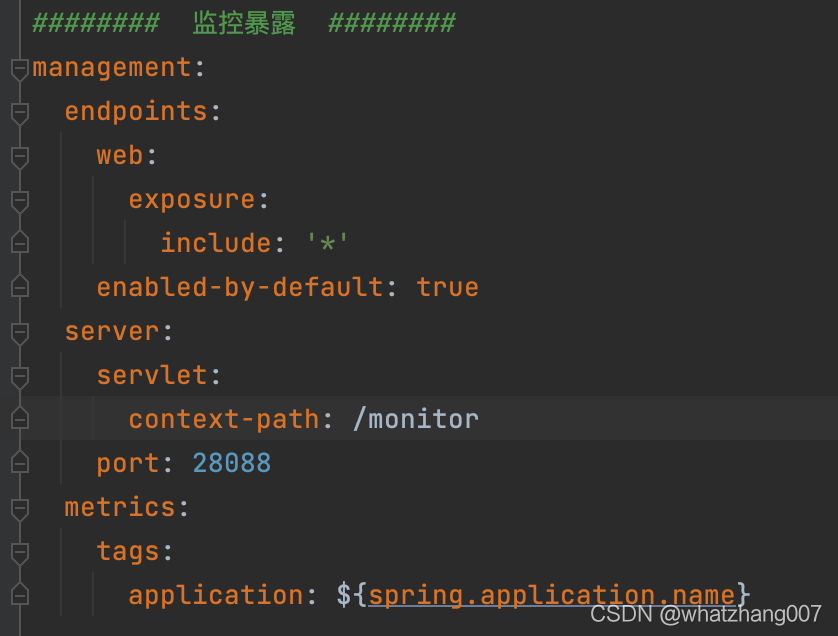
配置
<dependency>
    <groupId>org.springframework.boot</groupId>
    <artifactId>spring-boot-starter-actuator</artifactId>
</dependency>
<dependency>
    <groupId>io.micrometer</groupId>
    <artifactId>micrometer-registry-prometheus</artifactId>
</dependency>
<dependency>
    <groupId>io.micrometer</groupId>
    <artifactId>micrometer-core</artifactId>
</dependency>
<dependency>
    <groupId>de.ahus1.prometheus.hystrix</groupId>
    <artifactId>prometheus-hystrix</artifactId>
    <version>4.1.0</version>
</dependency>
https://github.com/ahus1/prometheus-hystrix
/**
 * @author zhang
 * @desc HystrixPrometheusMetrics监控合成
 * @date 2021/8/18 09:32
 */
@Configuration
public class HystrixMetricsConfig {


    @Autowired
    private CollectorRegistry registry;

    /**
     * 将hystrix.stream格式转换成prometheus metrics格式
     */
    @PostConstruct
    public void init() {


        HystrixPrometheusMetricsPublisher.builder().withRegistry(registry).buildAndRegister();
    }
}
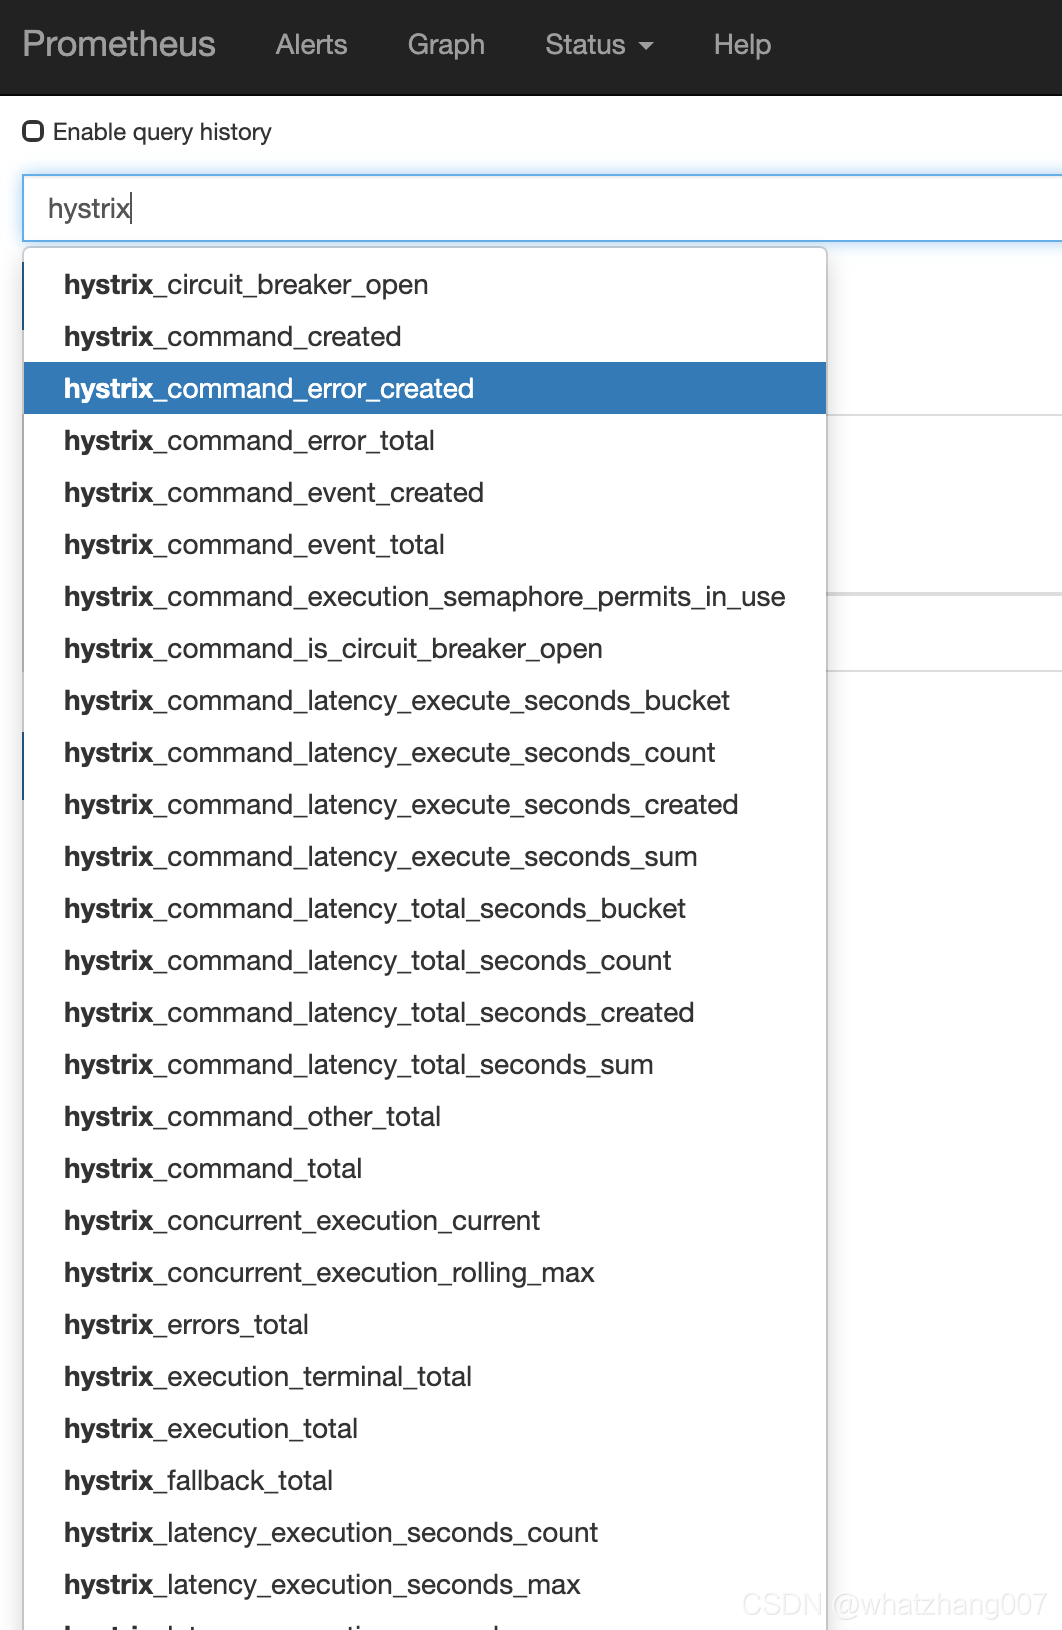
Prometheus查看暴露指标
Grafana展示
编号: 7145
网址:https://grafana.com/grafana/dashboards?search=hystrix
效果图:

自定义指标配置json
{


  "annotations": {


    "list": [
      {


        "builtIn": 1,
        "datasource": "-- Grafana --",
        "enable": true,
        "hide": true,
        "iconColor": "rgba(0, 211, 255, 1)",
        "name": "Annotations & Alerts",
        "type": "dashboard"
      }
    ]
  },
  "description": "备份",
  "editable": true,
  "gnetId": 7145,
  "graphTooltip": 0,
  "id": 46,
  "iteration": 1629869899880,
  "links": [],
  "panels": [
    {


      "cacheTimeout": null,
      "colorBackground": false,
      "colorValue": false,
      "coloraalue": true,
      "colors": [
        "rgba(245, 54, 54, 0.9)",
        "rgba(237, 129, 40, 0.89)",
        "rgba(50, 172, 45, 0.97)"
      ],
      "datasource": "Prometheus-dsp-executor",
      "decimals": null,
      "format": "none",
      "gauge": {


        "maxValue": 100,
        "minValue": 0,
        "show": false,
        "thresholdLabels": false,
        "thresholdMarkers": true
      },
      "gridPos": {


        "h": 9,
        "w": 4,
        "x": 0,
        "y": 0
      },
      "hideTimeOverride": true,
      "id": 2,
      "interval": null,
      "links": [],
      "mappingType": 1,
      "mappingTypes": [
        {


          "name": "value to text",
          "value": 1
        },
        {


          "name": "range to text",
          "value": 2
        }
      ],
      "maxDataPoints": 100,
      "nullPointMode": "connected",
      "nullText": null,
      "postfix": "",
      "postfixFontSize": "50%",
      "prefix": "",
      "prefixFontSize": "50%",
      "rangeMaps": [
        {


          "from": "null",
          "text": "N/A",
          "to": "null"
        }
      ],
      "sparkline": {


        "fillColor": "rgba(31, 118, 189, 0.18)",
        "full": false,
        "lineColor": "rgb(31, 120, 193)",
        "show": false
      },
      "tableColumn": "",
      "targets": [
        {


          "expr": "hystrix_command_is_circuit_breaker_open{command_group=~\"$commandGroup\",command_name=~\"$commandName\"}",
          "format": "time_series",
          "hide": false,
          "interval": "",
          "intervalFactor": 1,
          "legendFormat": "",
          "metric": "ml_hystrix_command_is_circuit_breaker_open",
          "refId": "A",
          "step": 1
        }
      ],
      "thresholds": "0,1",
      "timeFrom": "15s",
      "timeShift": null,
      "title": "Circuit Breaker Status",
      "type": "singlestat",
      "valueFontSize": "150%",
      "valueMaps": [
        {


          "op": "=",
          "text": "N/A",
          "value": "null"
        },
        {


          "op": "=",
          "text": "OK",
          "value": "1"
        },
        {


          "op": "=",
          "text": "NOT WELL",
          "value": "0"
        }
      ],
      "valueName": "current"
    },
    {


      "cacheTimeout": null,
      "colorBackground": false,
      "colorValue": false,
      "coloraalue": true,
      "colors": [
        "rgba(245, 54, 54, 0.9)",
        "rgba(237, 129, 40, 0.89)",
        "rgba(50, 172, 45, 0.97)"
      ],
      "datasource": "Prometheus-dsp-executor",
      "decimals": null,
      "format": "none",
      "gauge": {


        "maxValue": 100,
        "minValue": 0,
        "show": false,
        "thresholdLabels": false,
        "thresholdMarkers": true
      },
      "gridPos": {


        "h": 9,
        "w": 4,
        "x": 4,
        "y": 0
      },
      "hideTimeOverride": true,
      "id": 19,
      "interval": null,
      "links": [],
      "mappingType": 1,
      "mappingTypes": [
        {


          "name": "value to text",
          "value": 1
        },
        {


          "name": "range to text",
          "value": 2
        }
      ],
      "maxDataPoints": 100,
      "nullPointMode": "connected",
      "nullText": null,
      "postfix": "",
      "postfixFontSize": "50%",
      "prefix": "",
      "prefixFontSize": "50%",
      "rangeMaps": [
        {


          "from": "null",
          "text": "N/A",
          "to": "null"
        }
      ],
      "sparkline": {


        "fillColor": "rgba(31, 118, 189, 0.18)",
        "full": false,
        "lineColor": "rgb(31, 120, 193)",
        "show": false
      },
      "tableColumn": "",
      "targets": [
        {


          "expr": "sum(hystrix_command_event_total{event=\"success\",command_group=~\"$commandGroup\",app=~\"$service\"})",
          "format": "time_series",
          "hide": false,
          "interval": "",
          "intervalFactor": 1,
          "legendFormat": "",
          "metric": "ml_hystrix_command_is_circuit_breaker_open",
          "refId": "A",
          "step": 1
        }
      ],
      "thresholds": "0,1",
      "timeFrom": "15s",
      "timeShift": null,
      "title": "Overall Status",
      "type": "singlestat",
      "valueFontSize": "150%",
      "valueMaps": [
        {


          "op": "=",
          "text": "N/A",
          "value": "null"
        },
        {


          "op": "=",
          "text": "OK",
          "value": "1"
        },
        {


          "op": "=",
          "text": "NOT WELL",
          "value": "0"
        }
      ],
      "valueName": "current"
    },
    {


      "cacheTimeout": null,
      "colorBackground": false,
      "colorValue": true,
      "colors": [
        "rgba(50, 172, 45, 0.97)",
        "rgba(237, 129, 40, 0.89)",
        "rgba(245, 54, 54, 0.9)"
      ],
      "datasource": "Prometheus-dsp-executor",
      "decimals": null,
      "format": "percent",
      "gauge": {


        "maxValue": 100,
        "minValue": 0,
        "show": false,
        "thresholdLabels": false,
        "thresholdMarkers": true
      },
      "gridPos": {


        "h": 9,
        "w": 4,
        "x": 8,
        "y": 0
      },
      "hideTimeOverride": true,
      "id": 16,
      "interval": nu
最低0.47元/天 解锁文章


 1174
1174

 被折叠的 条评论
为什么被折叠?
被折叠的 条评论
为什么被折叠?
 到【灌水乐园】发言


