代码如下
% 清空环境变量
clear;
clc;
% 定义频率范围
f = linspace(0,2000000, 10000000); % 频率范围 [995kHz, 1005kHz]
% 定义功率谱密度函数 G_x(f)
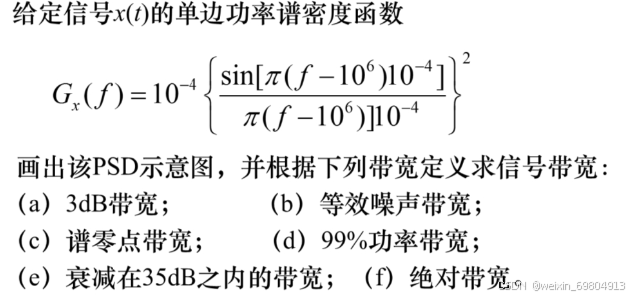
G_x = @(f) 1e-4 * (sin(pi*(f - 1e6)*1e-4) ./ (pi*(f - 1e6)*1e-4)).^2;
% 计算 G_x(f) 对应的值
Gf = G_x(f);
% 绘制功率谱密度函数 (PSD)
figure;
plot(f, Gf, 'LineWidth', 2);
grid on;
title('功率谱密度函数 G_x(f)');
xlabel('频率 (Hz)');
ylabel('功率谱密度 G_x(f)');
ylim([0, 1.5e-4]); % 设定 y 轴范围
xlim([0 2.010e6]); % 设定 x 轴范围
% (a) 计算 3dB 带宽
halfPowerLevel = max(Gf) / 2; % 3dB 对应最大值的一半
f_3dB = f(Gf >= halfPowerLevel); % 查找 G_x(f) 大于 3dB 点的频率范围
BW_3dB = f_3dB(end) - f_3dB(1); % 计算 3dB 带宽
% (b) 等效噪声带宽
NEB = trapz(f, Gf) / max(Gf); % 使用积分计算等效噪声带宽
% (c) 谱零点带宽
f_zero = f(Gf <= 1e-10); % 查找接近零点的频率
BW_zero = f_zero(end) - f_zero(1); % 计算谱零点带宽
% (d) 99% 功率带宽
total_power = trapz(f, Gf); % 总功率(面积)
cumulative_power = cumtrapz(f, Gf); % 累积功率
BW_99 = f(find(cumulative_power >= 0.99 * total_power, 1)) - ...
f(find(cumulative_power >= 0.01 * total_power, 1)); % 99% 功率带宽
% (e) 衰减到 35dB 带宽
attenuation_35dB = max(Gf) / (10^(35/10)); % 35dB 衰减点
f_35dB = f(Gf >= attenuation_35dB); % 查找 G_x(f) 大于 35dB 衰减点的频率范围
BW_35dB = f_35dB(end) - f_35dB(1); % 计算 35dB 带宽
% (f) 绝对带宽
BW_absolute = f(end) - f(1); % 最大频率减去最小频率的范围
% 输出带宽结果
fprintf('3dB 带宽: %.2f Hz\n', BW_3dB);
fprintf('等效噪声带宽: %.2f Hz\n', NEB);
fprintf('谱零点带宽: %.2f Hz\n', BW_zero);
fprintf('99%% 功率带宽: %.2f Hz\n', BW_99);
fprintf('35dB 衰减带宽: %.2f Hz\n', BW_35dB);
fprintf('绝对带宽: %.2f Hz\n', BW_absolute);
% ----------------- 在图上标记带宽 --------------------
% 标记 3dB 带宽
hold on;
plot([f_3dB(1), f_3dB(1)], [0, halfPowerLevel], '--r', 'LineWidth', 1.5);
plot([f_3dB(end), f_3dB(end)], [0, halfPowerLevel], '--r', 'LineWidth', 1.5);
text(f_3dB(1), halfPowerLevel, ' 3dB 带宽', 'Color', 'r', 'VerticalAlignment', 'bottom');
% 标记等效噪声带宽
plot([f(1), f(1) + NEB], [max(Gf), max(Gf)], '--g', 'LineWidth', 1.5);
text(f(1) + NEB, max(Gf), ' 等效噪声带宽', 'Color', 'g', 'VerticalAlignment', 'bottom');
% 标记谱零点带宽
plot([f_zero(1), f_zero(1)], [0, G_x(f_zero(1))], '--b', 'LineWidth', 1.5);
plot([f_zero(end), f_zero(end)], [0, G_x(f_zero(end))], '--b', 'LineWidth', 1.5);
text(f_zero(1), G_x(f_zero(1)), ' 谱零点带宽', 'Color', 'b', 'VerticalAlignment', 'bottom');
% 标记99%功率带宽
f_99_low = f(find(cumulative_power >= 0.01 * total_power, 1));
f_99_high = f(find(cumulative_power >= 0.99 * total_power, 1));
plot([f_99_low, f_99_low], [0, G_x(f_99_low)], '--m', 'LineWidth', 1.5);
plot([f_99_high, f_99_high], [0, G_x(f_99_high)], '--m', 'LineWidth', 1.5);
text(f_99_low, G_x(f_99_low), ' 99% 功率带宽', 'Color', 'm', 'VerticalAlignment', 'bottom');
% 标记 35dB 带宽
plot([f_35dB(1), f_35dB(1)], [0, attenuation_35dB], '--k', 'LineWidth', 1.5);
plot([f_35dB(end), f_35dB(end)], [0, attenuation_35dB], '--k', 'LineWidth', 1.5);
text(f_35dB(1), attenuation_35dB, ' 35dB 带宽', 'Color', 'k', 'VerticalAlignment', 'bottom');
% 标记绝对带宽
plot([f(1), f(1)], [0, max(Gf)], ':c', 'LineWidth', 1.5);
plot([f(end), f(end)], [0, max(Gf)], ':c', 'LineWidth', 1.5);
text(f(1), max(Gf), ' 绝对带宽', 'Color', 'c', 'VerticalAlignment', 'bottom');
hold off;