


NCScope: Android应用程序中本地代码的硬件辅助分析器
ABSTRACT
More and more Android apps implement their functionalities in native code, so does malware.
越来越多的Android应用使用原生代码实现其功能,恶意软件也是如此。
本机代码(Native Code)或称为原生代码,是指为特定类型的处理器(如x86、ARM等)直接编写的,可以直接被该处理器的硬件执行的机器语言代码或接近机器语言的汇编代码。这种代码不依赖于任何高级编程语言的运行时环境(如Java虚拟机JVM、Python解释器等),因此通常具有更高的执行效率和性能。
Although various approaches have
been designed to analyze the native code used by apps, they usually
generate incomplete and biased results due to their limitations in
obtaining and analyzing high-fidelity execution traces and memory
data with low overheads.
尽管已经设计了各种方法来分析应用程序使用的本机代码,但由于它们在 获取和分析 高保真执行跟踪和低开销内存数据 方面的局限性,它们通常会生成不完整和有偏差的结果。
高保真(High-fidelity)通常指的是在数据获取或信号传输过程中,能够保持原始信息的高度准确性和完整性,尽量减少失真或损失。
高保真确保了数据的准确性和可靠性,而低开销则保证了这种数据获取方式不会对系统性能造成显著影响。这对于需要高效、准确地分析复杂软件系统的场景尤为重要。
然而,在实际应用中,同时实现高保真和低开销往往是一个挑战。高保真数据的获取可能需要更复杂的监控和记录机制,这可能会增加开销。因此,在设计分析和调试工具时,需要在保真度和开销之间找到一个平衡点,以满足特定场景下的需求。
在软件分析和调试中,需要同时关注数据的准确性和获取数据的效率。这要求开发者在设计相关工具时,充分考虑如何平衡这两个方面的需求,以实现对软件系统的有效监控和分析。
To fill the gap, in this paper, we propose
and develop a novel hardware-assisted analyzer for native code in
apps. We leverage ETM, a hardware feature of ARM platform, and
eBPF, a kernel component of Android system, to collect real execution traces and relevant memory data of target apps, and design new
methods to scrutinize native code according to the collected data.
为了填补这一空白,在本文中,我们提出并开发了一种新的硬件辅助分析仪,用于应用程序中的本机代码。我们利用ARM平台的硬件特性ETM和Android系统的内核组件eBPF收集目标应用程序的真实执行轨迹和相关内存数据,并根据收集到的数据设计新的方法来审查本机代码。
ARM平台指的是基于ARM架构的处理器和系统平台。
ARM架构的核心特点是其高效能和低功耗,这使得它非常适合于需要长时间运行且对能源消耗有严格要求的设备,如智能手机、平板电脑、可穿戴设备、物联网(IoT)设备、嵌入式系统以及许多其他类型的计算设备。
ARM平台的硬件特性中,ETM(Embedded Trace Macrocell,嵌入式跟踪宏单元)是一个关键组件,它为ARM微处理器提供了实时指令跟踪和数据跟踪的能力。
- 实时跟踪能力:
- ETM能够实时地跟踪处理器的指令执行和数据访问,这使得开发人员能够准确地了解程序的行为和性能瓶颈。
- 高灵活性:
- ETM支持多种配置选项,可以根据不同的调试需求进行定制。例如,可以设置过滤器来限制捕获的信息量,以减少调试过程中的数据量和复杂度。
- 非干预性:
- ETM的跟踪过程对处理器的正常运行影响极小,几乎不会引起性能下降或中断程序执行。这使得ETM成为嵌入式系统调试中的理想工具。
嵌入式系统是一种专用计算机系统,它以应用为中心,以计算机技术为基础,具备软件硬件可裁剪的特点,能够适应应用系统对功能、可靠性、成本、体积、功耗等严格要求。
Android系统的内核组件eBPF(extended Berkeley Packet Filter)是一个强大的技术,它允许在操作系统的内核中运行沙盒程序,以安全和有效地扩展内核功能。
eBPF是Android系统中一个非常重要的内核组件,它允许开发者以安全和有效的方式扩展内核功能。通过编写eBPF程序,开发者可以监控和调试系统性能、实现网络统计与管控、跟踪系统调用等,从而优化系统性能和提升用户体验。
沙盒程序是一种在计算机系统中使用的特殊程序或环境,它主要用于满足特定的测试、培训、运行演示、启用或概念验证(POC)等目的。
定义与特性
- 定义:沙盒程序是一个隔离的环境,用于运行可能存在安全隐患或未知来源的程序或代码,以防止这些程序对系统核心部分造成损害。
- 隔离性:沙盒程序的核心特性是隔离性。在沙盒中运行的程序无法直接访问系统资源和敏感数据,从而避免了应用程序之间的相互干扰和数据泄漏的风险。
工作原理
沙盒程序通过创建一个或多个独立的进程来运行应用程序,每个进程都拥有自己独立的内存空间和资源。这种隔离机制确保了即使沙盒中的程序出现崩溃或异常情况,也不会影响到系统或其他应用程序的正常运行。
安全性措施
- 指令限制:沙盒程序通过限制执行指令来防止恶意行为。例如,限制跳转指令JMP的使用,防止恶意代码随意跳转到系统内存中的任意位置。
- 资源限制:沙盒程序可以对应用程序的资源使用进行限制,如CPU利用率、内存使用量等。这可以防止某个应用程序占用过多的系统资源,导致其他应用程序运行缓慢。
- 访问控制:沙盒程序通过访问控制列表(ACL)或用户权限来限制应用程序对系统资源的访问。这包括文件系统、网络接口等关键资源的访问权限控制。
结论
沙盒程序是一种重要的安全机制,它通过提供隔离的运行环境来保障系统的安全性和稳定性。无论是在安全测试、培训与开发还是在线代码编辑器等领域,沙盒程序都发挥着重要的作用。
To show the unique capability of NCScope, we apply it to four applications that cannot be accomplished by existing tools, including
systematic studies on self-protection and anti-analysis mechanisms
implemented in native code of apps, analysis of memory corruption
in native code, and identification of performance differences between functions in native code. The results uncover that only 26.8%
of the analyzed financial apps implement self-protection methods in
native code, implying that the security of financial apps is far from
expected. Meanwhile, 78.3% of the malicious apps under analysis
have anti-analysis behaviors, suggesting that NCScope is very useful to malware analysis. Moreover, NCScope can effectively detect
bugs in native code and identify performance differences.
为了展示NCScope的独特功能,我们将其应用于现有工具无法完成的四个应用程序中,包括 应用程序本机代码中实现的自我保护和反分析机制的系统研究,本机代码中内存损坏的分析,以及本机代码中函数之间性能差异的识别。结果显示,被分析的金融应用程序中只有26.8%在本机代码中实现了自我保护方法,这意味着金融应用程序的安全性与预期相差甚远。同时,78.3%的被分析恶意应用具有反分析行为,说明NCScope对于恶意软件分析非常有用。此外,NCScope可以有效地检测本地代码中的bug并识别性能差异。
1 INTRODUCTION
Android continuously dominates the smartphone market with over
70% share [53]. A recent study [91] showed that about 40% benign
apps use native code for implementing advanced functionalities
or achieving better performance. Sumaya et al. disclosed that native code has been widely used in very popular apps [56]. Many
guidelines [28, 37] also suggest that security-sensitive apps (e.g.,
mobile banking apps) should implement self-protection techniques
in native code to prevent them from running in rooted devices
and being tampered. Meanwhile, researchers discovered that malicious apps always abuse native code to perform anti-analysis
[55, 88, 90, 94, 99, 102]. Therefore, tools for analyzing native code
in apps are highly demanded for researchers to characterize apps
using native code, for store maintainers to uncover unwanted activities implemented in native code, and for app developers to diagnose
bugs and performance issues.
Android以超过70%的市场份额持续统治智能手机市场[53]。最近的一项研究[91]表明,大约40%的良性应用程序使用本机代码来实现高级功能或获得更好的性能。Sumaya等人披露原生代码在非常流行的应用中被广泛使用[56]。许多指南[28,37]还建议,对安全敏感的应用程序(例如,移动银行应用程序)应该在本机代码中实现自我保护技术,以防止它们在 获得超级用户权限的设备上 运行并被篡改。同时,研究人员发现恶意应用经常会滥用本机代码进行反分析[55,88,90,94,99,102]。因此,分析应用程序中的本机代码的工具是非常需要的,研究人员使用工具来描述使用本机代码的应用程序,商店维护人员使用工具来发现在本机代码中实现的不必要的活动,应用程序开发人员使用工具来诊断错误和性能问题。
However, it is challenging to analyze native code in Android
apps. On the one hand, the complexity of native code [69] and the
adopted dynamic features (e.g., dynamically loading) [63, 66, 79,
81] impede the static analysis of native code. On the other hand,
although a number of dynamic analysis approaches have been designed for inspecting native code in apps, they usually generate
incomplete and biased results due to their limitations in obtaining
and analyzing high-fidelity execution traces and memory data with
low overheads. More precisely, the majority of existing dynamic
analysis approaches rely on three kinds of underlying techniques,
including debugger [100], dynamic binary instrumentation (DBI)
frameworks [96], and emulator [55, 88, 93, 94, 99]. Unfortunately,
these techniques have the following limitations that negatively
affect the analysis of native code.
然而,分析Android应用中的原生代码是一项挑战。一方面,本机代码的复杂性[69]和采用的动态特性(如动态加载)[63,66,79,81]阻碍了本机代码的静态分析。另一方面,虽然许多动态分析方法已经被设计出来用于检查应用程序中的本机代码,由于它们在 获取和分析 高保真执行跟踪和低开销内存数据 方面的局限性,通常会产生不完整和有偏差的结果。更准确地说,大多数现有的动态分析方法依赖于三种底层技术,包括调试器[100]、动态二进制仪表(DBI)框架[96]和仿真器[55,88,93,94,99]。不幸的是,这些技术有以下限制,会对本机代码的分析产生负面影响。
First, it is difficult for these techniques to collect all executed
instructions in an accurate and efficient manner because DBI and
emulator may incorrectly recognize and emulate instructions as revealed by recent studies[68, 80, 83] while debuggers can only access
an instruction through the single-step method [13]. Consequently,
behaviors of native code may be missed due to the incomplete instruction traces. Second, these techniques can be easily defeated by
anti-analysis methods in native code[95] because of their obvious
footprints. For example, debuggers change status of the debugged
process, DBI loads extra libraries and code to the app’s memory,
and emulator has special files and properties different from real systems (see ğ4.3). Note that malicious apps will hide their behaviors
once they discover the existence of dynamic analysis tools. Third,
these underlying techniques introduce significant overhead, which
leads to biased profiling results. For instance, DBI and emulator
based tools [82, 94, 96, 99] cause more than 10x slowdown. Such
a slowdown has been exploited by malware to detect these tools
through timing checks [43].
首先,这些技术很难准确有效地收集所有已执行的指令,因为最近的研究表明,动态二进制仪表DBI和仿真器可能会错误地识别和模拟指令[68,80,83],而调试器只能通过单步方法访问指令[13]。因此,由于指令跟踪不完整,可能会错过本机代码的行为。其次,这些技术很容易被本机代码中的反分析方法打败[95],因为它们明显的足迹。例如,调试器改变被调试进程的状态,动态二进制仪表DBI将额外的库和代码加载到应用程序的内存中,模拟器具有不同于实际系统的特殊文件和属性(参见ğ4.3)。请注意,恶意应用程序一旦发现动态分析工具的存在,就会隐藏其行为。第三,这些底层技术引入了显著的开销,从而导致有偏差的分析结果。例如,动态二进制仪表DBI和基于模拟器的工具[82,94,96,99]会导致超过10倍的减速。这种减速被恶意软件利用,通过定时检查来检测这些工具[43]。
To overcome the aforementioned limitations, we propose a novel
hardware-assisted analyzer named NCScope for native code in Android apps. Specifically, exploiting ETM (Embedded Trace Microcell), a hardware feature of ARM platform, we collect the executed ARM instructions of the app running in real device instead of emulators without the need of DBI frameworks or software-based
debuggers. Note that the overhead of collecting ARM instructions
through ETM is very low (around zero [2]). Meanwhile, we use
eBPF (Extended Berkeley Packet Filter), a kernel component of Android system introduced since Android 9.0, to efficiently obtain the
memory data used by the app. Moreover, we design new methods
to identify the behaviors of native code from the collected information by recovering the run-time function calls and data flow. Since
NCScope achieves efficient instruction tracing and memory data
retrieving, the evaluation results (in ğ5.1) show that it introduces
very low additional overhead (1.180x slowdown on average) to the
execution of apps, and it can bypass timing checks [43]. Based on
the collected data, users can develop analysis methods for characterizing native code in apps.
为了克服上述限制,我们提出了一种名为NCScope的新型硬件辅助分析仪,用于Android应用程序中的本机代码。具体而言,我们利用ARM平台的硬件特性ETM,在不需要DBI框架或基于软件的调试器的情况下,收集在真实设备而不是模拟器中运行的应用程序的已执行的ARM指令。请注意,通过ETM收集ARM指令的开销非常低(大约为零[2])。同时,我们使用Android 9.0以后引入的内核组件eBPF (扩展伯克利包过滤器)高效获取应用程序使用的内存数据。我们设计了新的方法,通过恢复 运行时函数调用和数据流,从收集到的信息中识别本机代码的行为。由于NCScope实现了高效的指令跟踪和内存数据检索,评估结果(在ğ5.1中)表明,它为应用程序的执行引入了非常低的额外开销(平均速度降低1.180倍),并且可以绕过时间检查[43]。根据收集到的数据,用户可以开发分析方法来表征应用程序中的本机代码。
To demonstrate the unique capability of NCScope, we equip it
with new analysis methods for four applications ( 1 - 4 ) that
cannot be accomplished by existing tools. We first use it to conduct
systematic studies on 1 self-protection behaviors of financial apps
(ğ5.2) and 2 anti-analysis behaviors of malicious apps (ğ5.3). Then,
we use NCScope to 3 detect memory corruption caused by CWE-
416 (use-after-free) and CWE-415 (double-free) (ğ5.4), which cannot
be diagnosed from the exceptions raised by Android system, and to
4 identify the performance differences between functions used in
native code (ğ5.5).
为了展示NCScope的独特功能,我们为NCScope配备了新的分析方法,来检测现有工具无法完成的四种应用(1 - 4)。我们首先用它对1金融类app的自我保护行为(ğ5.2)和2恶意app的反分析行为(ğ5.3)进行了系统研究。然后,我们使用NCScope 3检测CWE416 (use-after-free)和CWE-415 (double-free) (ğ5.4)导致的内存损坏,这无法从Android系统引发的异常中诊断出来,4识别本机代码中使用的函数之间的性能差异(ğ5.5)。
In summary, we make the following contributions:
综上所述,我们做出了以下贡献:
We propose NCScope, a new hardware-assisted analyzer for
native code in apps. It outperforms existing approaches in terms
of effectiveness, efficiency, evasion resilience, and overhead. The
artifacts of NCScope is available at DOI 10.5281/zenodo.6534525.
我们提出了NCScope,一个新的硬件辅助分析器,用于应用程序中的本机代码。它在有效性、效率、规避弹性和开销方面优于现有的方法。NCScope的工件可以在DOI 10.5281/zenodo.6534525获得。
We design new methods for NCScope to detect self-protection
and anti-analysis methods and diagnose memory corruption in
native code by recovering run-time function calls and data flow
from the collected instruction traces and memory data
我们为NCScope设计了新的方法来检测自我保护和反分析方法,并通过 从收集的指令跟踪和内存数据中 恢复 运行时函数调用 和 数据流 来诊断本机代码中的内存损坏.
We extensively evaluate NCScope and use it to conduct systematic studies on the native code based self-protection methods
adopted by financial apps and the anti-analysis mechanisms
used by malicious apps. The results show that NCScope introduces very small additional overhead. Moreover, it discovers
that a few (26.8%) of financial apps implement self-protection
methods whereas most (78.3%) of malicious apps under examination implement anti-analysis methods in their native code.
We also apply NCScope to detect memory corruption in native
code of apps to show that it can aid bug diagnosis and present a
case study to show that NCScope can aid performance analysis.
我们广泛评估了NCScope,并使用它 对 金融应用采用的基于本机代码的自我保护方法 和 恶意应用使用的反分析机制 进行了系统研究。结果表明,NCScope引入了非常小的额外开销。此外,研究发现,少数(26.8%)金融应用程序实施了自我保护方法,而大多数(78.3%)被检查的恶意应用程序在其本机代码中实现了反分析方法.
我们还应用NCScope来检测应用程序的本机代码中的内存损坏,以表明它可以帮助错误诊断,并提出一个案例研究,以表明NCScope可以帮助性能分析。
2 BACKGROUND
In this section, we introduce the background knowledge about ETM
in ğ2.1 and eBPF in ğ2.2.
本节将介绍关于ğ2.1中的ETM和ğ2.2中的eBPF的背景知识。
2.1 Embedded Trace Microcell
2.1嵌入式跟踪微单元
Embedded Trace Microcell (ETM) is a hardware feature of ARM
platform. It tracks the instructions executed by CPU via monitoring
instruction buses with almost no overhead [16]. When tracing the
executed instructions of a running app through ETM, it generates
trace elements, which contain the information (e.g., target addresses
of executed branch instructions of the target app) for recovering
the app’s run-time execution traces, and outputs them as an ETM
stream. Among the trace elements, we mainly resolve the Address
element because it stores the address of each tracked instruction,
which will be used to recover the app’s run-time behaviors (ğ4). According to Futuremark [8], all of the most popular 50 smartphones
are equipped with the ARM processors that support ETM.
嵌入式跟踪微单元(ETM)是ARM平台的一个硬件特性。它通过监视指令总线来跟踪CPU执行的指令,几乎没有开销[16]。当通过ETM跟踪正在运行的应用程序的执行指令时,它会生成跟踪元素,其中包含用于 恢复应用程序的运行时执行跟踪 的信息(例如,目标应用程序执行分支指令的目标地址),并将其输出为ETM流。在跟踪元素中,我们主要解析Address元素,因为它存储了每个跟踪指令的地址,这将用于恢复应用程序的运行时行为(ğ4)。根据Futuremark[8],所有最流行的50款智能手机都配备了支持ETM的ARM处理器。
2.2 Extended Berkeley Packet Filter
2.2 扩展的伯克利包过滤
Extended Berkeley Packet Filter (eBPF) is a lightweight and secure
in-kernel virtual machine for executing eBPF programs [17]. An
eBPF program can hook a kernel instruction by using the kernel
probe (kprobe) infrastructure [25] or a kernel tracepoint by using
the event tracing infrastructure [47]. Once the target instruction is
being executed, the corresponding eBPF program will be executed
to perform analyst-specified operations, e.g., getting a register value
or retrieving the memory data. Besides supporting the kernel instrumentation, an eBPF program can hook user-space programs
through the user-space probe (uprobe) [45]. Since Android 9.0, both
the kprobe and uprobe are supported by Android system. As bcc
[10] provides convenient programming interfaces to customize
eBPF programs, we use it to develop eBPF programs.
扩展伯克利包过滤器(eBPF)是一个轻量级和安全的内核内虚拟机,用于执行eBPF程序[17]。一个eBPF程序可以 通过使用内核探针(kprobe)基础设施[25] 挂钩内核指令 或者 通过使用事件跟踪基础设施[47] 挂钩内核跟踪点。一旦目标指令被执行,相应的eBPF程序将被执行 以执行分析员指定的操作,例如,获取寄存器值或检索内存数据。除了支持内核插装之外,eBPF程序还可以通过用户空间探针(uprobe)hook用户空间程序[45]。从Android 9.0开始,Android系统同时支持kprobe和uprobe。由于bcc( BPF Compiler Collection)[10]提供了方便的编程接口来定制eBPF程序,因此我们使用它来开发eBPF程序。
3 OVERVIEW OF NCSCOPE
As shown in Figure 1, NCScope consists of two modules: an ARMv8
based data collection module running an Android system (>=9.0)
loaded with eBPF programs, and an analysis module implementing
various new analysis methods. The rational of this two-module
architecture is to minimize the additional overhead. That is, we
let ARM platform only perform data collection (i.e., recording the
instruction trace and retrieving the in-memory data) while leave
data resolution (i.e., behavior identification) to the analysis module,
which runs in a separate PC.
如图1所示,NCScope由两个模块组成:一个是基于ARMv8的数据采集模块,运行在加载了eBPF程序的Android系统(>=9.0)上,另一个是实现了各种新的分析方法的分析模块。这种双模块架构的原理是最小化额外的开销。也就是说,我们让ARM平台只执行数据收集(即记录指令跟踪和检索内存数据),而将数据解析(即行为识别)留给在单独PC上运行的分析模块。
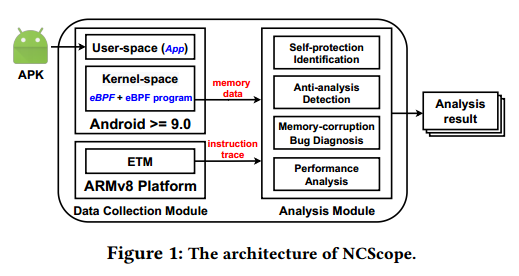
Taking in and launching an app to be analyzed, NCScope instructs
ETM to record the instructions executed by the app (see ğ3.1) and
invoke eBPF programs to retrieve the data from the app’s virtual
memory and save it to a memory region resided in the kernel-space
(see ğ3.2). Note that since the kernel configurations used for enabling eBPF (e.g., CONFIG_KPROBES, CONFIG_UPROBES) have already
been turned on in the recently released Android systems (since Android 9.0), NCScope requires no modification to Android kernel.
接收并启动要分析的应用程序,NCScope指示ETM记录应用程序执行的指令(参见ğ3.1),并调用eBPF程序从应用程序的虚拟内存中检索数据,并将其保存到 驻留在内核空间的 内存区域(参见ğ3.2)。请注意,由于 用于启用eBPF的 内核配置(例如,CONFIG_KPROBES, CONFIG_UPROBES)已经在最近发布的Android系统中打开(从Android 9.0开始),NCScope不需要修改Android内核。
When the execution of native code ends, the data collection module
outputs the instruction trace (e.g., ETM stream) and the memory
data collected by eBPF to the analysis module for accomplishing
various tasks, such as identifying self-protection and anti-analysis
behaviors of native code (see ğ4.2 and ğ4.3), diagnosing memory
corruption bugs (see ğ4.4), and measuring performance (see ğ5.5).
当本机代码执行结束时,数据收集模块 将指令跟踪(例如,ETM流)和eBPF收集的内存数据 输出到分析模块,以完成各种任务,例如识别本机代码的自我保护和反分析行为(参见ğ4.2和ğ4.3),诊断内存损坏错误(参见ğ4.4),以及测量性能(参见ğ5.5)。
Assumption. We assume that the apps to be analyzed cannot gain
the root privilege. That is, the apps can neither disable eBPF nor
load a kernel module that inspects the values of the registers used
for configuring ETM to detect the presence of NCScope. This assumption is rational because Android has already adopted various
techniques to protect the integrity of its kernel [41], and smartphone vendors have also employed many approaches [48] to secure
the kernels of their customized Android systems.
假设。我们假设要分析的应用程序不能获得root权限。也就是说,应用程序既不能禁用eBPF,也不能加载一个内核模块,该内核模块检查 用于配置ETM 以检测NCScope的存在 的寄存器的值。这种假设是合理的,因为Android已经采用了各种技术来保护其内核的完整性[41],智能手机供应商也采用了许多方法[48]来保护 其定制Android系统的 内核。
In this section, we describe the data collection module, including
how NCScope traces the executed instructions of an app (see ğ3.1)
and retrieves the accessed data from its virtual memory (see ğ3.2),
because such run-time data can be leveraged to characterize its
behaviors[64]. The analysis module will be described in ğ4.
在本节中,我们将描述数据收集模块,包括NCScope如何跟踪应用程序执行的指令(参见ğ3.1)并从其虚拟内存中检索访问的数据(参见ğ3.2),因为可以利用这些运行时数据 来表征其行为[64]。分析模块将在ğ4中描述。
3.1 Tracing Instructions
3.1跟踪指令
NCScope uses ETM to trace an app’s executed instructions. By default, ETM records the target address of each indirect branch instruction executed by CPU. However, it is non-trivial to recover the app’s behaviors from such an ETM stream due to two reasons.
NCScope使用ETM来跟踪应用程序执行的指令。默认情况下,ETM记录 CPU执行的每条间接分支指令的 目标地址。然而,由于两个原因,从这样一个ETM流中恢复应用程序的行为是很重要的。
间接分支指令是一种通过变量或寄存器中的值来间接确定跳转目标地址的程序控制指令。它具有灵活性高的特点,但也存在预测和执行复杂的缺点。在程序设计中,需要根据实际需求来合理使用间接分支指令,以平衡程序的灵活性和性能。
(1) The ETM stream contains a large amount of trace elements that are irrelevant to the analyzed app, because the target addresses of all indirect branch instructions executed by CPU will be recorded.
(2) The ETM stream contains only the target address of each executed indirect branch instruction.
To recover the function calls performed
by the app, which is essential for recovering its behaviors, the target
address of each executed direct branch instruction is also needed,
because the execution of such an instruction may refer to a method
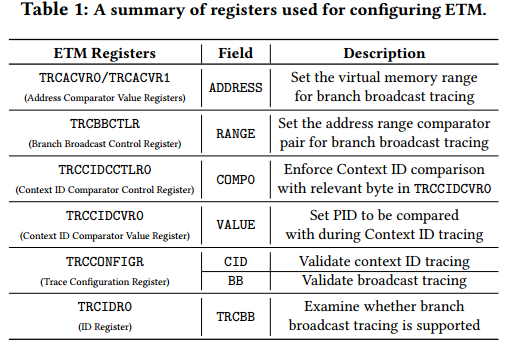
invocation. To address these issues, NCScope enables the context
ID tracing and branch broadcasting tracing of ETM. Table 1 lists
the ETM registers used for enabling and configuring the tracing.
We elaborate how NCScope adjusts these ETM registers as follows.
(1) ETM流中含有大量与被分析应用无关的跟踪元素,因为 CPU执行的所有间接分支指令的目标地址 都将被记录下来。(2) ETM流只包含 每个被执行的间接分支指令的目标地址。为了恢复应用程序执行的函数调用,这对于恢复其行为至关重要,还需要 每个执行的直接分支指令的目标地址,因为此类指令的执行可能会引用方法调用。为了解决这些问题,NCScope启用了ETM的上下文ID跟踪和分支广播跟踪。表1列出了用于 启用和配置 跟踪的 ETM寄存器。
我们详细说明NCScope如何调整这些ETM寄存器,如下所示。


 被折叠的 条评论
为什么被折叠?
被折叠的 条评论
为什么被折叠?
 到【灌水乐园】发言


