Echarts 时间轴监听事件
1. 背景
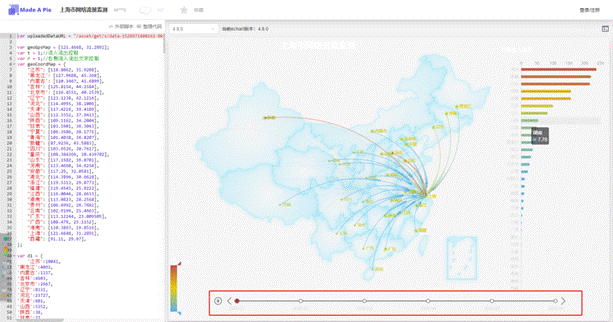
- 需求:通过页面某个组件内时间轴的变化控制其他组件的echarts的数据变化;
2. 解决方法
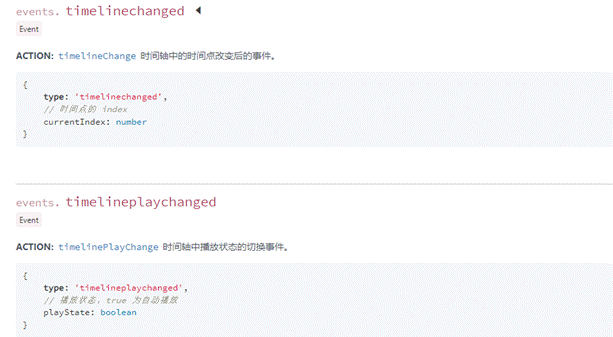
this.myChart_3.on("timelinechanged", function (params) {
  console.log(params);
  if (params.type === "timelinechanged") {
   console.log(params.currentIndex);
  }
 });
timeline: {
tooltip: {
show: false,
},
data: years,
axisType: "category",
autoPlay: false,
triggerEvent: true,
playInterval: 5000,
left: "10%",
right: "10%",
bottom: "2%",
width: "80%",
label: {
normal: {
textStyle: {
color: "#ddd",
},
},
emphasis: {
textStyle: {
color: "#fff",
},
},
},
symbolSize: 10,
lineStyle: {
color: "#555",
},
checkpointStyle: {
borderColor: "#777",
borderWidth: 2,
},
controlStyle: {
showNextBtn: true,
showPrevBtn: true,
normal: {
color: "#666",
borderColor: "#666",
},
emphasis: {
color: "#aaa",
borderColor: "#aaa",
},
},
}


 2917
2917

 被折叠的 条评论
为什么被折叠?


