<!DOCTYPE html>
<html lang="en">

<head>
    <meta charset="UTF-8">
    <meta http-equiv="X-UA-Compatible" content="IE=edge">
    <meta name="viewport" content="width=device-width, initial-scale=1.0">
    <title>Document</title>
    <script src="./echarts.js"></script>
    <style>
        #main {
            width: 563px;
            height: 220px;
            background-color: #0d1934;
        }
    </style>
</head>

<body>
    <div id="main"></div>
</body>
<script>
    var chartDom = document.getElementById('main');
    var myChart = echarts.init(chartDom);
    var option;

    var xdata = ['设备OEE', '时间开动率', '性能开动率', '合格品率'];
    var data = [70, 60, 80, 80];
    var maxArr = [100, 100, 100, 100];
    option = {
        tooltip: {
            trigger: "axis",
            axisPointer: { // 坐标轴指示器,坐标轴触发有效
                type: 'shadow' // 默认为直线,可选为:'line' | 'shadow'
            },
            // borderRadius: 5,
            // borderColor: "#6baab2",
            // borderWidth: 1,
            formatter: function(params) { // params[0].data.nameCode
                let dot =
                    '<span style="display:inline-block;margin-right:5px;border-radius:50%;width:10px;height:10px;background-color:#02C4DD"></span>';
                return (
                    params[0].name +
                    "<br>" +
                    "杆塔数量 :" +
                    params[0].value
                );
            }
        },
        grid: {
            left: "4%",
            right: "4%",
            bottom: "3%",
            top: "18%",
            containLabel: true
        },
        xAxis: {
            data: xdata,
            triggerEvent: true,
            axisTick: {
                show: false
            },
            axisLine: {
                show: false
            },
            axisLabel: {
                show: true,
                rotate: 0,
                interval: 0,
                textStyle: {
                    // padding: [14, 0, 0, 0],
                    fontSize: 12,
                    color: "rgba(255,255,255,1)"
                }
            }
        },
        yAxis: {
            name: "单位:个数",
            triggerEvent: true,
            nameTextStyle: {
                color: "rgba(255,255,255,1)",
                fontSize: 12,
                padding: [0, 0, 10, -20]
            },
            splitLine: {
                show: true,
                lineStyle: {
                    color: 'rgba(255,255,255,.1)'
                }
            },
            axisTick: {
                show: false
            },
            axisLine: {
                show: true,
                lineStyle: {
                    color: 'rgba(255,255,255,.1)'
                }
            },
            axisLabel: {
                show: true,
                textStyle: {
                    color: "rgb(148,159,167)",
                    fontSize: 12
                }
            }
        },
        // color: ["#e54035"],
        series: [{
            name: "数量",
            barMinHeight: 10,
            type: "pictorialBar",
            barCategoryGap: "60%",
            // symbol: 'path://M0,10 L10,10 L5,0 L0,10 z',
            symbol: "path://M0,10 L10,10 C5.5,10 5.5,5 5,0 C4.5,5 4.5,10 0,10 z",
            itemStyle: {
                normal: {
                    //barBorderRadius: 5,
                    //渐变色
                    color: new echarts.graphic.LinearGradient(0, 0, 0, 1, [{
                        offset: 0,
                        color: "#01EAED"
                    }, {
                        offset: 0.5,
                        color: "#02C4DD"
                    }, {
                        offset: 1,
                        color: "#029ED9"
                    }])
                }
            },
            label: {
                normal: {
                    show: true,
                    position: "top",
                    textStyle: {
                        color: "#fff",
                        fontSize: 12
                    }
                }
            },
            data: data,
            z: 10
        }, {
            name: "hill",
            type: "bar",
            barWidth: '40%',
            // symbol: "path://M0,10 L10,10 C5.5,10 5.5,5 5,0 C4.5,5 4.5,10 0,10 z",
            itemStyle: {
                normal: {
                    color: "rgba(255,255,255,0.05)"
                }
            },
            data: maxArr,
            z: 9
        }]
    }

    option && myChart.setOption(option);
</script>

</html>


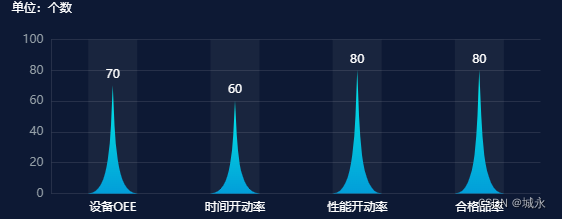
 本文展示了如何使用ECharts库创建了一张设备OEE、时间开动率、性能开动率和合格品率的数据可视化图表,通过柱状图和饼图展示数据,便于理解和分析生产线的运行情况。


 1126
1126

 被折叠的 条评论
为什么被折叠?
被折叠的 条评论
为什么被折叠?
 到【灌水乐园】发言


