<template>
<div v-if="data.length > 0" ref="linechart" v-resize="resizeCharts" class="chart" />
<EmptyData v-else text="暂无数据" />
</template>
<script>
import * as echarts from "echarts";
import { EmptyData } from "@common/OtherComp";
export default {
name: "Linechart",
components: {
EmptyData,
},
props: {
color: {
type: String,
default: "red",
},
yAxisName: {
type: String,
default: "%",
},
data: {
type: Array,
default() {
return [];
},
},
xAxisData: {
type: Array,
default() {
return [];
},
},
},
data() {
return {
charts: null,
};
},
computed: {},
watch: {
data: {
handler() {
if (this.charts) {
this.setOption();
} else {
this.initCharts();
}
},
},
color: {
handler() {
if (this.charts) {
this.setOption();
} else {
this.initCharts();
}
},
},
},
mounted() {
this.initCharts();
},
beforeDestroy() {
this.charts && this.charts.dispose();
this.charts = null;
},
methods: {
resizeCharts() {
this.charts.resize();
},
initCharts() {
this.$nextTick(() => {
if (this.data.length > 0) {
this.charts = echarts.init(this.$refs.linechart);
this.charts.clear();
this.setOption();
}
});
},
setOption() {
const option = this.getOption();
this.charts.setOption(option, true);
var elementDiv = document.getElementById("extension");
if (!elementDiv) {
var div = document.createElement("div");
div.setAttribute("id", "extension");
div.style.display = "block";
document.querySelector("html").appendChild(div);
}
this.charts.on("mouseover", function (params) {
if (params.componentType == "xAxis" && params.value.length > 3) {
var elementDiv = document.querySelector("#extension");
var elementStyle =
"position: absolute;z-index: 99999;color: #fff;font-size: 12px;padding: 5px;display: inline;border-radius: 4px;background-color: #6f6f6f;box-shadow: rgba(0, 0, 0, 0.3) 2px 2px 8px";
elementDiv.style.cssText = elementStyle;
elementDiv.innerHTML = params.value;
document.querySelector("html").onmousemove = function (event) {
var elementDiv = document.querySelector("#extension");
var xx = event.pageX - 10;
var yy = event.pageY + 15;
elementDiv.style.top = yy + "px";
elementDiv.style.left = xx + "px";
};
}
});
this.charts.on("mouseout", function (params) {
if (params.componentType == "xAxis") {
var elementDiv = document.querySelector("#extension");
elementDiv.style.cssText = "display:none";
}
});
},
getOption() {
const option = {
color: [this.color, "blue"],
legend: {
bottom: 10,
},
grid: {
left: 50,
right: 50,
},
tooltip: {
trigger: "axis",
padding: [10, 16],
},
xAxis: {
type: "category",
boundaryGap: false,
data: this.xAxisData,
axisTick: {
show: false,
},
axisLine: {
lineStyle: {
color: "#F1F1F1",
},
},
triggerEvent: true,
axisLabel: {
color: "#3c3c3c",
formatter: function (value) {
if (value.length > 3) {
return `${value.slice(0, 3)}...`;
}
return value;
},
},
},
yAxis: {
type: "value",
name: this.yAxisName,
nameTextStyle: {
color: "#3c3c3c",
},
show: true,
splitLine: {
show: true,
},
axisTick: {
show: false,
},
axisLine: {
lineStyle: {
color: "#F1F1F1",
},
},
axisLabel: {
color: "#3c3c3c",
},
},
dataZoom: [
{
show: false,
xAxisIndex: 0,
maxValueSpan: 96,
minValueSpan: 60,
start: 0,
end: 100,
showDetail: false,
},
{
type: "inside",
xAxisIndex: 0,
},
],
series: this.data.map((item, index) => {
return {
name: item.name,
data: item.data,
type: "line",
lineStyle: item.lineStyle,
markLine: item.markLine,
};
}),
};
return option;
},
},
};
</script>
<style scoped lang="less">
.chart {
width: 100%;
height: 100%;
}
</style>


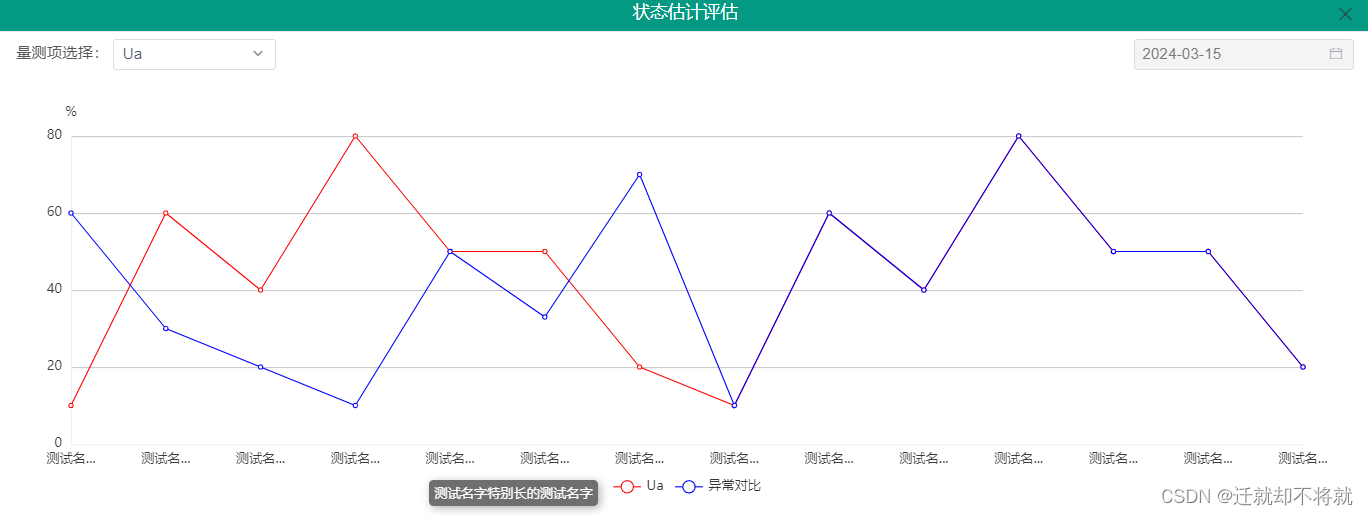
 文章描述了一个使用Vue.js编写的Linechart组件,它利用ECharts库创建交互式图表,展示动态数据,包括X轴、Y轴定制和鼠标悬停提示功能。


 835
835

 被折叠的 条评论
为什么被折叠?
被折叠的 条评论
为什么被折叠?
 到【灌水乐园】发言


