


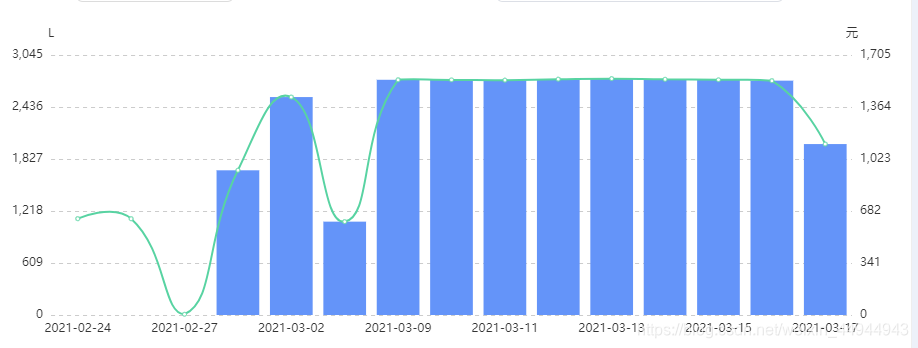
 此博客介绍如何配置动态图表,通过后台数据请求实时更新水厂加药量和费用的y轴范围,以适应实时数据变化。
<ve-histogram :data="chartData1" :settings="chartSettings1" :extend="chartExtend1"></ve-histogram>
配置:
this.chartExtend1 = {
            color: ["rgb(100,148,249)","rgb(88,211,162)"],
            legend: {
                // icon: "rect",
                bottom: "3",
                textStyle: {    //文字样式
                    fontSize: 14,
                    // color: ["rgb(16,194,34)","rgb(240,151,34)"],
                }
            },
            yAxis: {
                splitLine: {
                show: true,
                lineStyle:{
                    type:'dashed'
                }
                }
            },
            tooltip: {
                trigger: "axis",
                formatter: function (params) {
                    let str = `${params[0].name}<br>
                    ${params[0].seriesName}:${params[0].value}L<br>
                    ${params[1].seriesName}:${params[1].value}元<br>
                `;
                    return str;
                },
            },
            'yAxis.0.max': 5,
            'yAxis.0.min': 0,
            'yAxis.0.interval': 1,
            'yAxis.1.max': 5,
            'yAxis.1.min': 0,
            'yAxis.1.interval': 1,
    }

this.chartSettings1 = {
        labelMap: {
            jyl: "加药量", //图例重命名
            jyfy: "加药费用",
        },
        metrics: ['jyl', 'jyfy'],
        showLine: ['jyfy'],
        axisSite: { right: ['jyfy'] },
        yAxisName: ['L', '元'],
    }
请求后台数据,设置y轴最大值和最小值
getJyList() { // 查询水厂加药列表
        this.chartData1.rows = []
        let params = {
            pcode: this.pcode,
            stm: this.stm,
            etm: this.etm,
            type:this.xzms,
            jytype:'1'
        };
        yhfxApi.getJyList(params)
            .then((res) => {
                if(res.data.status == 1) {
                    let jyInfo  = res.data.data;
                    this.chartData1.rows = jyInfo || [];
                    if (this.chartData1.rows.length > 0) {
                        let y1 = [];
                        let y2 = [];
                        this.chartData1.rows.forEach(e => {
                            y1.push(e.jyl);
                            y2.push(e.jyfy);
                        });
                        let y1max = Math.max.apply(null, y1);
                        let y2max = Math.max.apply(null, y2);
                        this.chartExtend1["yAxis.0.max"] = parseInt(y1max + (y1max * 0.1)) ;
                        this.chartExtend1["yAxis.0.min"] = 0;
                        this.chartExtend1["yAxis.0.interval"] =parseInt((y1max + (y1max * 0.1)) / 5) ;

                        this.chartExtend1["yAxis.1.max"] = parseInt(y2max + (y2max * 0.1)) ;
                        this.chartExtend1["yAxis.1.min"] = 0;
                        this.chartExtend1["yAxis.1.interval"] = parseInt((y2max + (y2max * 0.1)) / 5) ;
                    }
                }
            })
            .catch((err) => {
                console.log(err);
            });
    },


 1180
1180

 被折叠的 条评论
为什么被折叠?
被折叠的 条评论
为什么被折叠?
 到【灌水乐园】发言


