


 本文介绍了如何在Vue项目中利用Echarts的WaterWaveBall组件,创建具有波浪效果的数据可视化图表,通过实例演示了如何设置最大值、实时值,并展示了两个水球波浪图的实现过程。
封装echarts组件——vue中,波浪效果展示数据
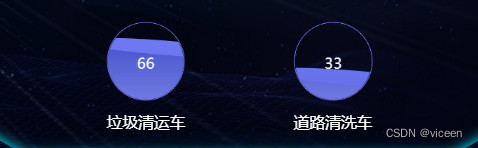
效果
代码
1、使用页面
<template>
    <div class='water_ball_sp'>
        <div class='water_ball_item'>
            <WaterWaveBall :id="'daily-water-wave-ball'" :max="100" :value="66"></WaterWaveBall>
            <p style="color:#fff">垃圾清运车</p>
        </div>
        <div class='water_ball_item'>
            <WaterWaveBall :id="'other-water-wave-ball'" :max="100" :value="33"></WaterWaveBall>
            <p style="color:#fff">道路清洗车</p>
        </div>
    </div>
</template>
<script>
import WaterWaveBall from '@/components/console/echarts/WaterWaveBall';
export default {
  data () {},
  components: { WaterWaveBall }
}
</script>
<style>
.water_ball_sp{
    width: 100%;
    .water_ball_item{
       width: 36%;
       height: 200px;
       float: left;
       margin-left: 14%;
       p{
           font-size: 14px;
           font-family: Microsoft YaHei;
           font-weight: 400;
           color: #FFFFFF;
           text-align: center;
       }
     }
     .water_ball_item:nth-child(2){
         margin-left: 0;
     }
}
</style>
2、引入组件
src\components\console\echarts\WaterWaveBall.vue
<template>
  <div class="canvas" style="width: 100%;heigth: 100%; text-align: center; float: left">
    <canvas :id="id"  :style="style" ></canvas>
  </div>
</template>

<script>
export default {
  name: 'WaterWaveBall',
  data () {
    return {
      ratio: 0,
      canvas: '',
      context: '',
      mW: 0,
      mH: 0,
      r: 0,
      cR: 0,
      sX: 0,
      axisLength: 0, // 轴长
      waveWidth: 0.008, // 波浪宽度,数越小越宽
      waveHeight: 6, // 波浪高度,数越大越高
      speed: 0.05, // 波浪速度,数越大速度越快
      xOffset: 0, // 波浪x偏移量
      IsDrawCircled: false,
      style: {
        width: window.innerHeight * 0.1 + 'px',
        height: window.innerHeight * 0.1 + 'px'
      }
    };
  },
  props: [
    'max',
    'id',
    'value'
  ],
  mounted () {
    this.canvas = document.getElementById(this.id);
    this.context = this.canvas.getContext('2d');
    // 画布属性
    this.mW = this.canvas.width = window.innerHeight * 0.16;
    this.mH = this.canvas.height = window.innerHeight * 0.16;
    const lineWidth = 1;

    // 圆属性
    this.r = this.mH / 2; // 圆心
    this.cR = this.r - 10 * lineWidth; // 圆半径

    this.axisLength = this.mW;

    this.context.lineWidth = lineWidth;

    this.render();
  },

  methods: {
    drawCircle () {
      // 画多边形函数
      this.context.beginPath();
      this.context.lineWidth = 1;
      this.context.strokeStyle = '#727DF5';
      this.context.arc(this.r, this.r, this.cR + 1, 0, 2 * Math.PI);
      this.context.stroke();
      this.context.beginPath();
      this.context.arc(this.r, this.r, this.cR, 0, 2 * Math.PI);
      this.context.clip();
      this.IsDrawCircled = true;
    },

    drawSin (xOffset, waveHeight, beginColor, endColor) {
      this.ratio = (this.value / this.max) * 100;
      this.context.save();

      const points = []; // 用于存放绘制Sin曲线的点

      this.context.beginPath();
      // 在整个轴长上取点
      for (let x = this.sX; x < this.sX + this.axisLength; x += 20 / this.axisLength) {
        // 此处坐标(x,y)的取点,依靠公式 “振幅高*sin(x*振幅宽 + 振幅偏移量)”
        const y = Math.sin((-this.sX - x) * this.waveWidth + xOffset) * 0.8 + 0.1;

        const dY = this.mH * (1 - this.ratio / 100);

        points.push([x, dY + y * waveHeight]);
        this.context.lineTo(x, dY + y * waveHeight);
      }

      // 封闭路径
      this.context.lineTo(this.axisLength, this.mH);
      this.context.lineTo(this.sX, this.mH);
      this.context.lineTo(points[0][0], points[0][1]);
      this.context.fillStyle = this.linearGradientColor(beginColor, endColor);
      this.context.fill();

      this.context.restore();
    },

    render () {
      this.context.clearRect(0, 0, this.mW, this.mH);

      if (this.IsDrawCircled === false) {
        this.drawCircle();
      }

      this.drawSin(this.xOffset + Math.PI * 0.5, 18, '#727DF5', '#5A65E2');
      this.drawSin(this.xOffset, 18, '#3743C1', '#99A1FB');
      this.drawText();

      this.xOffset += this.speed;
      requestAnimationFrame(this.render);
    },
    drawText () {
      this.context.save();

      const size = 0.4 * this.cR;
      this.context.font = size + 'px Microsoft Yahei';
      this.context.textAlign = 'center';
      this.context.fillStyle = '#EEF4FF';
      this.context.fillText(this.value, this.r, this.r + size / 2);

      this.context.restore();
    },
    linearGradientColor (beginColor, endColor) {
      const linearGradient = this.context.createLinearGradient(0, 0, 0, 200);
      linearGradient.addColorStop(0, beginColor);
      // linearGradient.addColorStop(0.71, '#429EFE');
      linearGradient.addColorStop(1, endColor);
      return linearGradient;
    }
  }
};
</script>

<style scoped>

</style>


 1561
1561


 到【灌水乐园】发言


