


【1】引言
前述学习过程中,我们多次探索过直方图画法,不过都是以ax.bar()的形式绘制,文章链接包括但不限于下述部分:
python画图|在3D图上画2D直方图(作图平面移动)_python 2d graph on different plane-优快云博客
python画图|3D直方图基础教程_python画三维直方图-优快云博客
python画图|水平直方图绘制_绘制水平直方图-优快云博客
今天我们学习一种新的画法,使用hist()函数画直方图。
【2】官网教程
点击下述链接直达官网:
https://matplotlib.org/stable/plot_types/stats/hist_plot.html#sphx-glr-plot-types-stats-hist-plot-py
官网代码非常简洁,我做了注释。
【3】代码解读
首先引入画图和计算模块:
import matplotlib.pyplot as plt #引入画图模块
import numpy as np #引入计算模块
然后定义画图风格:
plt.style.use('_mpl-gallery') #设置画图风格
之后定义随机数因变量:
np.random.seed(1) #定义随机数种子
x = 4 + np.random.normal(0, 1.5, 200) #生成随机因变量
下一步定义要画图:
fig, ax = plt.subplots() #定义要画图
然后调用hist()函数画直方图:
ax.hist(x, bins=8, linewidth=0.5, edgecolor="white") #绘制直方图
最后设置坐标轴属性,输出图像:
ax.set(xlim=(0, 8), xticks=np.arange(1, 8),
       ylim=(0, 56), yticks=np.linspace(0, 56, 9)) #坐标轴设置

plt.show() #输出图形
运行代码,获得的图像为:
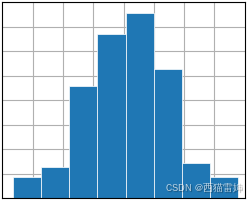
图1
此时的完整代码为:
import matplotlib.pyplot as plt #引入画图模块
import numpy as np #引入计算模块

plt.style.use('_mpl-gallery') #设置画图风格

# make data
np.random.seed(1) #定义随机数种子
x = 4 + np.random.normal(0, 1.5, 200) #生成随机因变量

# plot:
fig, ax = plt.subplots() #定义要画图

ax.hist(x, bins=8, linewidth=0.5, edgecolor="white") #绘制直方图

ax.set(xlim=(0, 8), xticks=np.arange(1, 8),
       ylim=(0, 56), yticks=np.linspace(0, 56, 9)) #坐标轴设置

plt.show() #输出图形
【4】代码改写
首先取消画图风格代码,将其改为注释。
然后修改fig定义代码以实现多个图形绘制:
fig, (ax0,ax1) = plt.subplots(2,1) #定义要画图
然后分别用hist()函数和bar()函数输出直方图:
ax0.hist(x, bins=8, linewidth=0.5, edgecolor="white") #绘制直方图
ax1.bar(5*x,1,0.2) #这里使用5*x是因为随机数太小,直方图会挤在一起
将坐标设置改为仅设置hist()函数所绘制直方图对应坐标:
ax0.set(xlim=(0, 8), xticks=np.arange(1, 8),
       ylim=(0, 56), yticks=np.linspace(0, 56, 9)) #坐标轴设置
运行代码后的图像为:
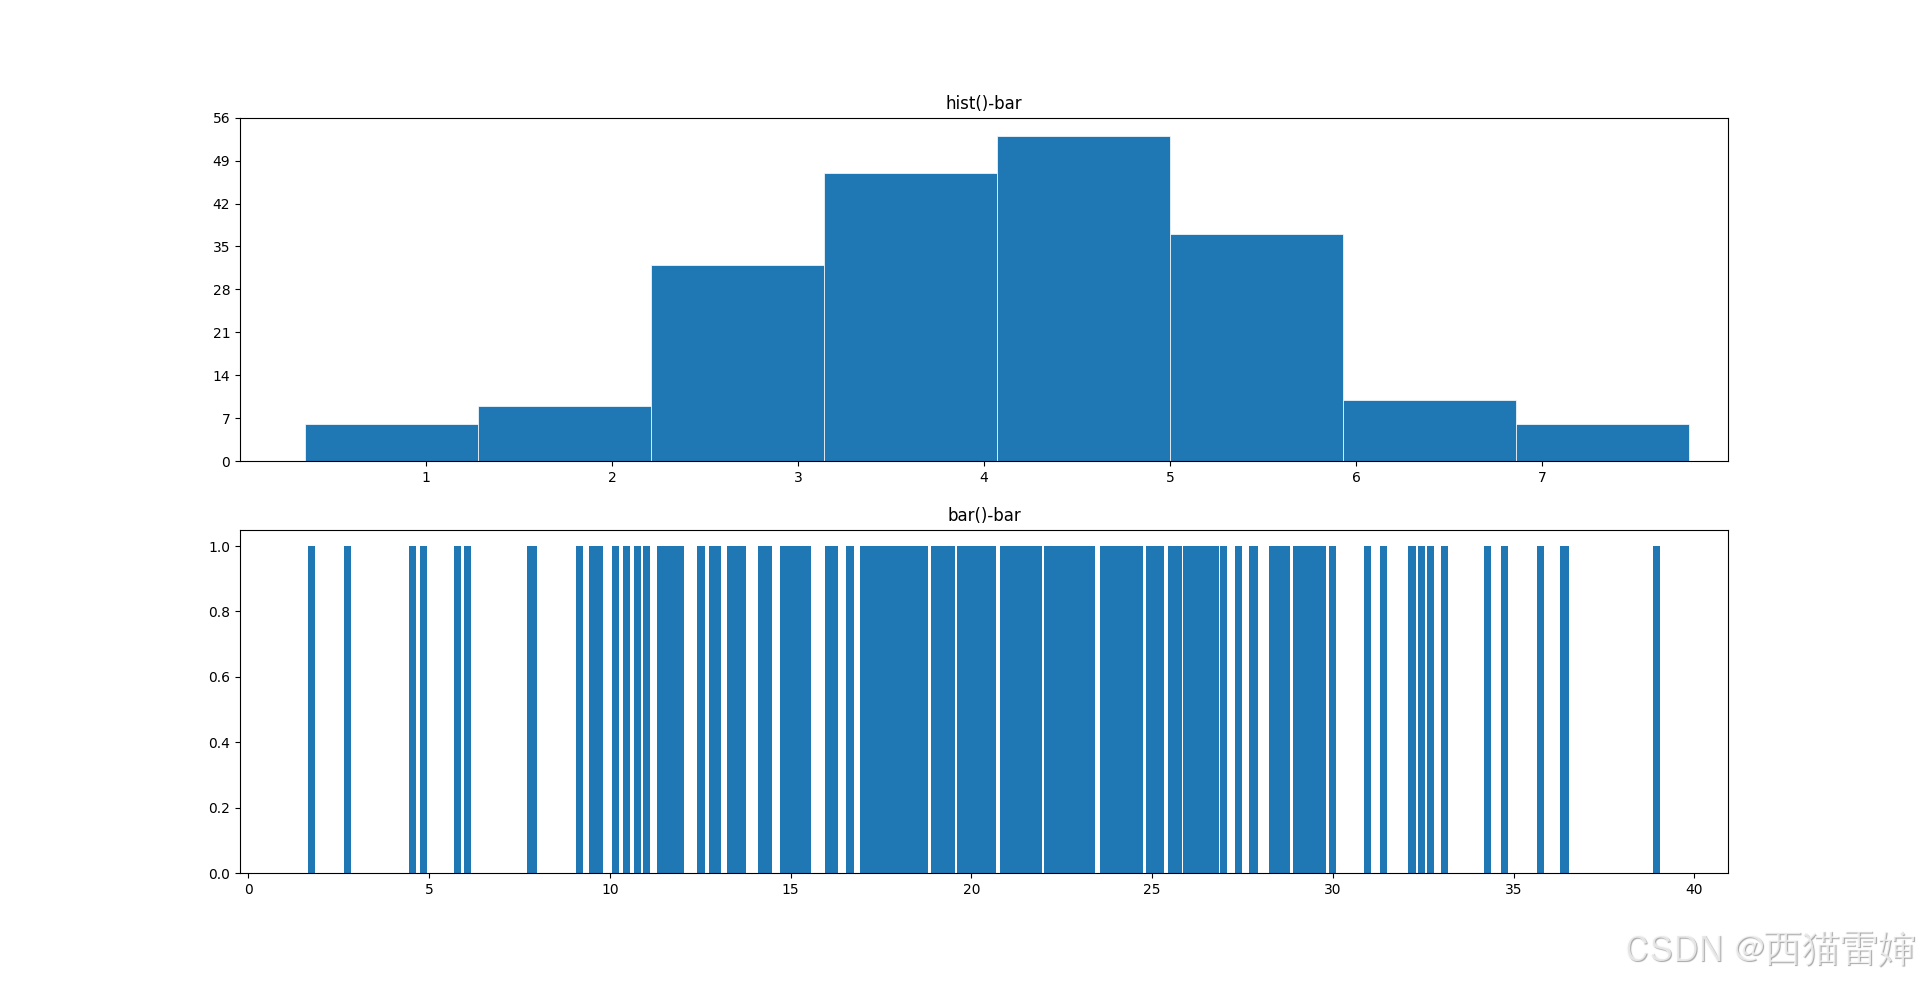
图2
由图2可见,调用hist()函数和bar()函数都可以绘制出直方图。
但在这里我们也看出了一些不同。
对于hist()函数,变量包括下述部分:
Axes.hist(x, bins=None, range=None, density=False, weights=None, cumulative=False, bottom=None, histtype='bar', align='mid', orientation='vertical', rwidth=None, log=False, color=None, label=None, stacked=False, *, data=None, **kwargs)
关键部分一般包括:
x:直方图画图X轴坐标值
bins:画直方图的个数
对于bar()函数,变量包括下述部分:
Axes.bar(x, height, width=0.8, bottom=None, *, align='center', data=None, **kwargs)
关键部分一般包括:
x:直方图画图X轴坐标值
height:直方图高度
width:直方图宽度
【5】总结
初步学习了hist()函数画直方图技巧。


 5295
5295

 被折叠的 条评论
为什么被折叠?
被折叠的 条评论
为什么被折叠?
 到【灌水乐园】发言


