


 文章介绍了如何在AzureAKS集群中使用Kubernetes监控每个pod的CPU和内存资源,并通过自定义搜索查询和性能指标实现告警功能。用户需要替换特定参数如clusterID和percentage以适应其环境。
背景需求
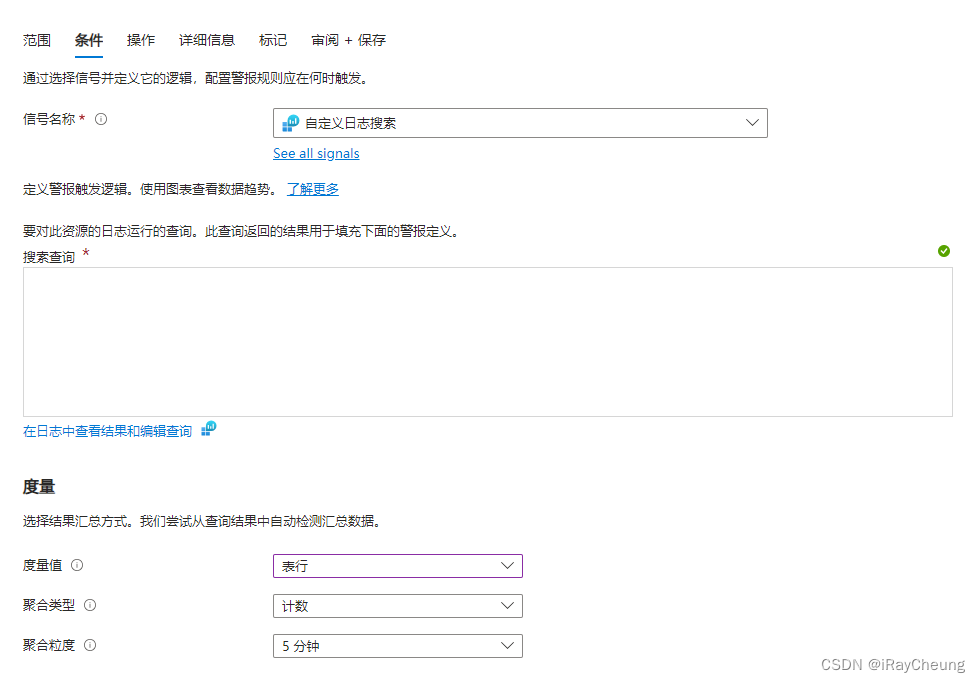
Azure AKS集群中,需要对部署的服务进行监控和告警,需要创建并启用预警规则,而这里怎么去监控每个pod级别的CPU和内存,需要自己写搜索查询
解决方法
搜索和查询的语句如下,需要自己替换其中的部分信息,其中的clusterID需要在AKS集群中的概述-右侧JSON视图-id,其中id就是我们要的clusterID,然后替换下面的clusterID字段内容。最后的 percentage 也需要根据实际情况来设置对应值。
#内存
let metricUsageCounterName = 'memoryRssBytes';
let metricLimitCounterName = 'memoryLimitBytes';
let clusterID = "/subscriptions/xxxxxxxxxxx";
let CachedFilteredPerfTable = Perf
| where ObjectName == 'K8SContainer'
| where InstanceName startswith clusterID
| project Node = Computer, TimeGenerated, CounterName, CounterValue, InstanceName;
let LimitsTable = CachedFilteredPerfTable
| where CounterName =~ metricLimitCounterName
| summarize arg_max(TimeGenerated, *) by Node, InstanceName
| project Node, InstanceName, LimitsValue = CounterValue, TimeGenerated;
let MetaDataTable = KubePodInventory
| where isnotempty(ClusterName) | where isnotempty(Namespace) | where isnotempty(Computer)
| where ClusterId =~ clusterID
| project TimeGenerated, ClusterId, Namespace, ControllerName, Node = Computer, Pod = Name, ContainerInstance = ContainerName, ContainerID, ControllerKind = ControllerKind
| summarize arg_max(TimeGenerated, *) by Node, ContainerInstance
| project Namespace, ControllerName, Node, Pod, ContainerInstance, InstanceName = strcat(ClusterId, '/', ContainerInstance), ContainerID, ControllerKind,
ContainerName = tostring(split(ContainerInstance, '/')[1]), LastPodInventoryTimeGenerated = TimeGenerated, ClusterId
| join kind=leftouter (LimitsTable) on Node, InstanceName
| project Namespace, ControllerName, Node, Pod, InstanceName, ContainerID, LimitsValue, ControllerKind, ContainerName, ContainerInstance, LastPodInventoryTimeGenerated, ClusterId;
let AggregationTable = CachedFilteredPerfTable
| where CounterName =~ metricUsageCounterName
| project TimeGenerated, Node, InstanceName, CounterValue
| summarize  Aggregation = percentile(CounterValue, 95) by Node, InstanceName
| project Node, InstanceName, Aggregation;
MetaDataTable
| join kind= leftouter( AggregationTable ) on Node, InstanceName
| order by ContainerName asc, ContainerName
| extend ContainerIdentity = strcat(ContainerName, '|', Pod)
| extend percentage = Aggregation/LimitsValue * 100
| project ContainerIdentity, percentage, Aggregation, LimitsValue, Node, ControllerName, ControllerKind, ContainerID, ContainerInstance, InstanceName, Namespace, LastPodInventoryTimeGenerated, ClusterId
| where percentage > 80


#CPU
let metricUsageCounterName = 'cpuUsageNanoCores';
let metricLimitCounterName = 'cpuLimitNanoCores';
let clusterID = "/subscriptions/xxxxxxxxxxx";
let CachedFilteredPerfTable = Perf
| where ObjectName == 'K8SContainer'
| where InstanceName startswith clusterID
| project Node = Computer, TimeGenerated, CounterName, CounterValue, InstanceName;
let LimitsTable = CachedFilteredPerfTable
| where CounterName =~ metricLimitCounterName
| summarize arg_max(TimeGenerated, *) by Node, InstanceName
| project Node, InstanceName, LimitsValue = CounterValue/1000000, TimeGenerated;
let MetaDataTable = KubePodInventory
| where isnotempty(ClusterName) | where isnotempty(Namespace) | where isnotempty(Computer)
| where ClusterId =~ clusterID
| project TimeGenerated, ClusterId, Namespace, ControllerName, Node = Computer, Pod = Name, ContainerInstance = ContainerName, ContainerID, ControllerKind = ControllerKind
| summarize arg_max(TimeGenerated, *) by Node, ContainerInstance
| project Namespace, ControllerName, Node, Pod, ContainerInstance, InstanceName = strcat(ClusterId, '/', ContainerInstance), ContainerID, ControllerKind,
ContainerName = tostring(split(ContainerInstance, '/')[1]), LastPodInventoryTimeGenerated = TimeGenerated, ClusterId
| join kind=leftouter (LimitsTable) on Node, InstanceName
| project Namespace, ControllerName, Node, Pod, InstanceName, ContainerID, LimitsValue, ControllerKind, ContainerName, ContainerInstance, LastPodInventoryTimeGenerated, ClusterId;
let AggregationTable = CachedFilteredPerfTable
| where CounterName =~ metricUsageCounterName
| project TimeGenerated, Node, InstanceName, CounterValue = CounterValue/1000000
| summarize  Aggregation = percentile(CounterValue, 95) by Node, InstanceName
| project Node, InstanceName, Aggregation;
MetaDataTable
| join kind= leftouter( AggregationTable ) on Node, InstanceName
| order by ContainerName asc, ContainerName
| extend ContainerIdentity = strcat(ContainerName, '|', Pod)
| extend percentage = Aggregation/LimitsValue * 100
| project ContainerIdentity, percentage, Aggregation, LimitsValue, Node, ControllerName, ControllerKind, ContainerID, ContainerInstance, InstanceName, Namespace, LastPodInventoryTimeGenerated, ClusterId
| where percentage > 80


 5118
5118

 被折叠的 条评论
为什么被折叠?
被折叠的 条评论
为什么被折叠?
 到【灌水乐园】发言


