


 在Vue项目中使用ECharts时,可以通过设置`formatter`来定制鼠标悬停时显示的标题。首先引入ECharts库,接着在DOM元素上绑定ID,并在`mounted`钩子中初始化配置。然后,你可以创建一个柱状图,并通过调整`formatter`函数,展示所需的内容。
1.首先我们要导入echart

2.绑定js代码 div的id绑定

并在mouted内

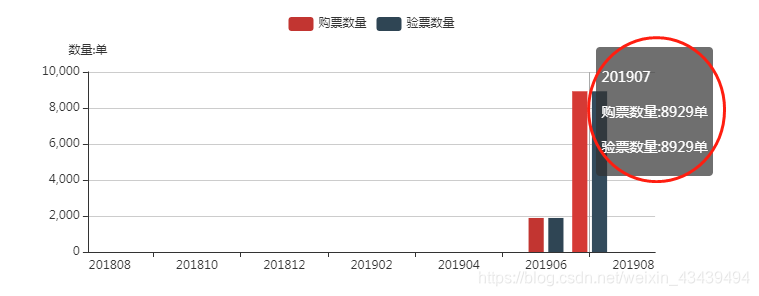
3.下面就编写自己所需要的图(本例是柱形图)
 var that = this
            this.userGrowth.setOption ({
            title: {
            },
            tooltip: {
                // trigger: 'axis'
                trigger: 'axis',
                formatter: function(params){
                    var res='<div><p>'+'</p></div>'
                    res+='<p>'+'</p>'
                    res+='<p>'+ timeList[params[0].dataIndex] +'</p>'
                    res+='<p>'+that.$t('T_The_ticket_number')+':'+ dataList1[params[0].dataIndex] + that.$t('T_single') +'</p>'
                    res+='<p>'+that.$t('T_Recount_the_number')+':'+ dataList2[params[0].dataIndex] + that.$t('T_single') +'</p>'
                    return  res;
                }

            },
            legend: {
                data:[this.$t('T_The_ticket_number'),this.$t('T_Recount_the_number')],

            },
            xAxis: {
                type: 'category',
                data: timeList
            },
            yAxis: {
                type: 'value',
                name:this.$t('T_number')+':'+this.$t('T_single'),
            },

            series: [{
                name: this.$t('T_The_ticket_number'),
                // type: 'line',
                type: 'bar',
                stack: '购票数量',
                smooth: true,
                data: dataList1,
                itemStyle : { normal: {label : {show: this.showData}}}
            },
            {
                name: this.$t('T_Recount_the_number'),
                // type: 'line',
                type: 'bar',
                stack: '验票数量',
                smooth: true,
                data: dataList2,
                itemStyle : { normal: {label : {show: this.showData}}}
            },

            ]
            });
        },
formatter所对应的的是鼠标悬浮时的显示


 4540
4540

 被折叠的 条评论
为什么被折叠?
被折叠的 条评论
为什么被折叠?
 到【灌水乐园】发言


