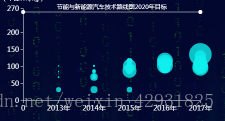
如果X轴刻度值不是数值,而是一些单位名称、时间、公司等,那么我们就要在xAxis中data中写出要展示的横坐标,纵坐标拷数据去获取一般情况下,如果纵坐标也不是数值,那么我们就可以和X轴刻度一样去在yAxis中设置一个data来接收这个值。
具体代码如下:
option = {
    xAxis: {
          splitLine: {
            show: false,
          },
          axisLabel: {    //设置坐标轴刻度样式
            textStyle: {
              fontSize: 14,
              fontWeight: 'normal',
            },
          },
          data: ['0', '2013年', '2014年', '2015年', '2016年', '2017年'],         //设置坐标轴刻度值,可以单独设置或者根据数据遍历
          boundaryGap: 0,    //坐标轴与刻度之间的空隙
        },
        yAxis: {
          min: 0,
          max: 270,
          name: '(单位Wh/kg)',
          splitLine: {
            show: false,
          },
          axisLabel: {
            textStyle: {
              fontSize: 14,
              fontWeight: 'normal',
            },
          },
          axisPointer: {  //坐标轴指示器提示鼠标放上图中显示数据
            lineStyle: {
              color: '#fff',
            },
            value: '140',
          },
        },
        grid: {
          top: '10%',
          bottom: '27%',
        },
        series: [{
          data: DataAll,
          type: 'scatter',
          symbolSize: function (parmas) {    //显示打点的值,即点的大小根据一个方法除数取整
            return Math.ceil(parmas[2] / 600);
          },
          label: {  //鼠标放在点上点的样式
            emphasis: {
              show: true,
              formatter: function (param) {
                return `${param.data[3]}-${param.data[4]}:${param.data[2]}`;
              },
              position: 'bottom',
            },
          },
          markLine: {    //标识线样式
            data: [      //标示线起始位置
              [
                { name: '标线1起点', xAxis: 0, yAxis: 260, symbol: 'circle' },
                { name: '标线1终点', xAxis: '2017年', yAxis: 260, symbol: 'circle' },

              ],
            ],
            label: {    标示线字体样式
              normal: {
                show: true,
                position: 'middle',
                formatter: '节能与新能源汽车技术路线图2020年目标',
              },
            },
            lineStyle: {   标示线线的样式
              normal: {
                type: 'solid',
                color: '#fff',
              },
            },
          },
          itemStyle: {
            normal: {
              color: '#0fefee',
            },
          },
        }],
}
效果图如下:


 博客介绍了Echarts坐标轴打点图的坐标设置方法。当X轴刻度值为单位名称、时间、公司等非数值时,需在xAxis的data中写出横坐标;若纵坐标也非数值,可在yAxis中设置data接收该值,并给出了具体代码和效果图。


 被折叠的 条评论
为什么被折叠?


