


 本文介绍如何利用Matplotlib在PyQt5界面中绘制动态图表,通过qtdesigner设计界面并使用PyUIC编译,实现了一个包含matplotlib图形的GUI应用,展示了从界面设计到逻辑实现的全过程。
**
Matplotlib图画PyQt5展示
**
qt designer制作界面
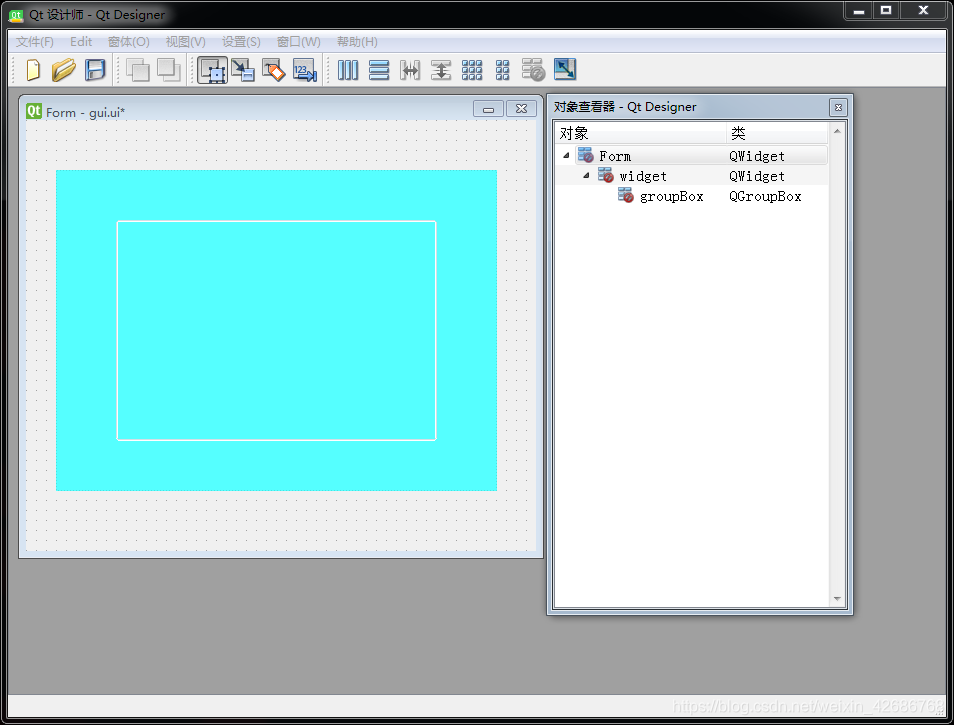
保存文件名为gui.ui文件,保存后用PyUIC编译为gui.py文件
编译后的代码
# -*- coding: utf-8 -*-

# Form implementation generated from reading ui file 'gui.ui'
#
# Created by: PyQt5 UI code generator 5.11.3
#
# WARNING! All changes made in this file will be lost!

from PyQt5 import QtCore, QtGui, QtWidgets

class Ui_Form(object):
    def setupUi(self, Form):
        Form.setObjectName("Form")
        Form.resize(510, 431)
        self.widget = QtWidgets.QWidget(Form)
        self.widget.setGeometry(QtCore.QRect(30, 50, 441, 321))
        self.widget.setStyleSheet("background-color: rgb(85, 255, 255);")
        self.widget.setObjectName("widget")
        self.groupBox = QtWidgets.QGroupBox(self.widget)
        self.groupBox.setGeometry(QtCore.QRect(60, 50, 321, 221))
        self.groupBox.setTitle("")
        self.groupBox.setObjectName("groupBox")

        self.retranslateUi(Form)
        QtCore.QMetaObject.connectSlotsByName(Form)

    def retranslateUi(self, Form):
        _translate = QtCore.QCoreApplication.translate
        Form.setWindowTitle(_translate("Form", "Form"))
新建main.py文件用于编写逻辑文件
#!/ust/bin/python3
# -*- coding: utf-8 -*-
import sys
from PyQt5.QtGui import *
from PyQt5.QtCore import *
from PyQt5.QtWidgets import *
from gui import Ui_Form #导入界面文件

import numpy as np
import matplotlib
matplotlib.use("Qt5Agg")  # 声明使用QT5
from matplotlib.backends.backend_qt5agg import FigureCanvasQTAgg as FigureCanvas
from matplotlib.figure import Figure
import matplotlib.pyplot as plt

'''
创建一个matplotlib图形绘制类,通过继承FigureCanvas类,使得该类既是一个PyQt5的Qwidget,又是一个matplotlib的FigureCanvas,这是连接pyqt5与matplotlib的关键
'''
class MyFigure(FigureCanvas):
    def __init__(self,width, height, dpi):
         # 创建一个Figure,该Figure为matplotlib下的Figure,不是matplotlib.pyplot下面的Figure
        self.fig = Figure(figsize=(width, height), dpi=dpi)
         # 在父类中激活Figure窗口,此句必不可少,否则不能显示图形
        super(MyFigure,self).__init__(self.fig)
         # 调用Figure下面的add_subplot方法,类似于matplotlib.pyplot下面的subplot(1,1,1)方法
        self.axes = self.fig.add_subplot(111)

class Mainwindow(QWidget, Ui_Form):
    def __init__(self):
        super(Mainwindow,self).__init__()
        self.setupUi(self)

        self.F = MyFigure(width=3, height=2, dpi=100)
        self.countdot()  #采集需要画的点位
        self.plotcos(self.t,self.s)  #画 图
         # 在GUI的groupBox中创建一个布局,用于添加MyFigure类的实例(即图形)。
        self.gridlayout = QGridLayout(self.groupBox)
        self.gridlayout.addWidget(self.F)

    def countdot(self):
        self.t = np.arange(0.0, 5.0, 0.01)
        self.s = np.cos(2 * np.pi * self.t)
        # self.t = [0,1,2,3,4,5]
        # self.s = [0,1,2,3,4,5]
    def plotcos(self, x, y):
        self.F.axes.plot(x, y)
        self.F.fig.suptitle("cos")

if __name__ == '__main__':
    app = QApplication(sys.argv)
    main = Mainwindow()
    main.show()
    sys.exit(app.exec_())
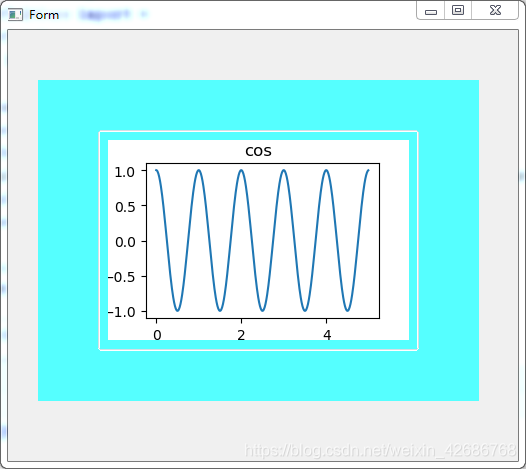
运行效果


 525
525

 被折叠的 条评论
为什么被折叠?
被折叠的 条评论
为什么被折叠?
 到【灌水乐园】发言


