


 本文介绍如何使用Pearson相关系数评估变量间的线性关系,并通过子集相关性分析深入理解数据特性。此外,还探讨了如何利用散点图直观展现变量间的关系,并提供了处理异常值的方法。最后,文章讨论了相关性在实际研究中的复杂性和潜在误导。
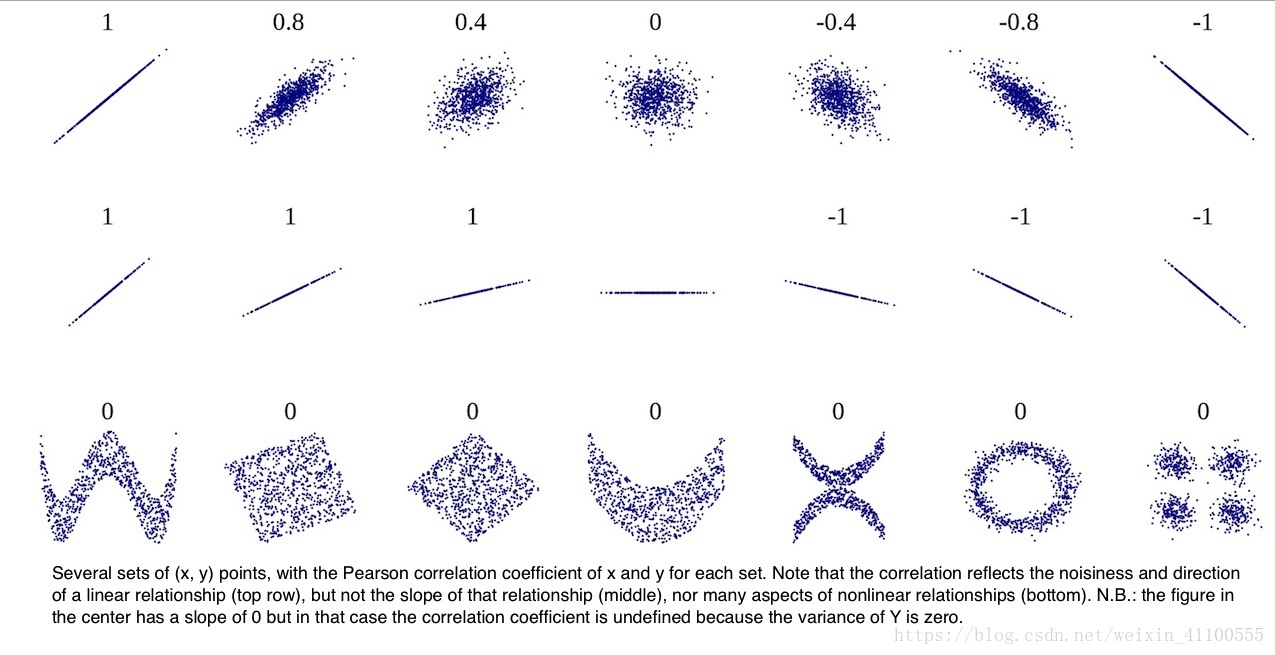
1、相关性
相关性图解指南:
相关系数
推论统计学入门-相关系数
相关系数除了用字母 r 表示以外,通常还用希腊字母 ρ 表示。
计算相关系数的默认方法是 Pearson,大多数统计软件都是如此。你无需在计算 Pearson 积差相关时传递方法参数。
> cor.test(pf$age,pf$friend_count,method = "pearson")

    Pearson's product-moment correlation

data:  pf$age and pf$friend_count
t = -8.6268, df = 99001, p-value < 2.2e-16
alternative hypothesis: true correlation is not equal to 0
95 percent confidence interval:
 -0.03363072 -0.02118189
sample estimates:
        cor
-0.02740737
关联大于0.3或者小于-0.3 表示有意义但是关联较小
0.5左右为中等
0.7以上为很大
> with(pf,cor.test(age,friend_count,method = "pearson"))

    Pearson's product-moment correlation

data:  age and friend_count
t = -8.6268, df = 99001, p-value < 2.2e-16
alternative hypothesis: true correlation is not equal to 0
95 percent confidence interval:
 -0.03363072 -0.02118189
sample estimates:
        cor
-0.02740737
2、子集相关性
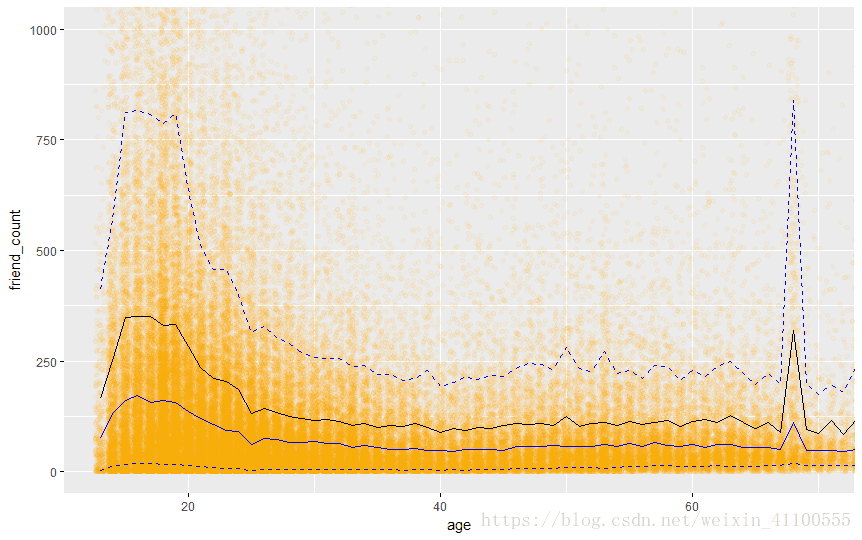
我们通过观察图片,我们发现不同的区间相关性不同,我们希望分不同区域来计算相关性。
> with(**subset(pf,pf$age<=70)**,cor.test(age, friend_count))

    Pearson's product-moment correlation

data:  age and friend_count
t = -52.592, df = 91029, p-value < 2.2e-16
alternative hypothesis: true correlation is not equal to 0
95 percent confidence interval:
 -0.1780220 -0.1654129
sample estimates:
       cor
-0.1717245
3、相关分析法
相关分析法
4、创建散点图
相关系数有用,但是它并不能代替从散点图以及其他图形中观察到的内容
ggplot(aes(x=likes_received,y=www_likes_received),data=pf)+
  geom_point()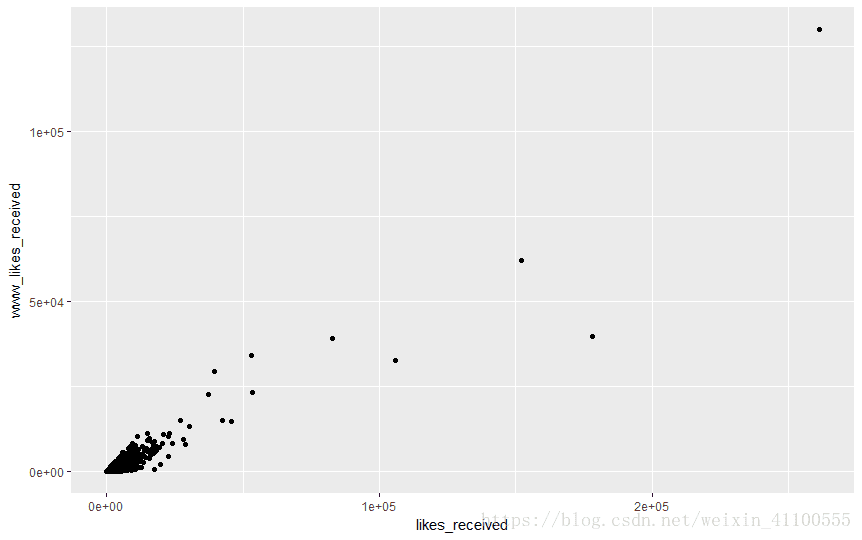
4、强相关
相关系数在 X 或 Y 的线性转换下是不变的,并且当 X 和 Y 都被转换为 z 分数时,回归线的斜率就是相关系数。
值得注意的是,我们并不总是对大部分数据感兴趣。有时候,我们关注的是异常值,而且重要的是,我们要了解它们的值以及它们为何出现在数据集中。
看上面的图,有一些跳跃的异常值。我们可以使用Quantile函数来设置x和y轴的极限。
ggplot(aes(x=likes_received,y=www_likes_received),data=pf)+
  geom_point()+
  xlim=(0,quantile(pf$likes_received,0.95))+
  ylim=(0,quantile(pf$www_likes_received,0.95))+
  geom_smooth(method = 'lm',color='red')
以上代码执行有问题,原因是xlim和ylim后面不能跟=,直接删除等号即可
ggplot(aes(x=likes_received,y=www_likes_received),data=pf)+
  geom_point()+
  xlim(0,quantile(pf$likes_received,0.95))+
  ylim(0,quantile(pf$www_likes_received,0.95))+
  geom_smooth(method = 'lm',color='red')
5.moria对于相关的研究
强相关并不一定都是好事
1、绘制三点图来观察相关量,同时计算相关系数来真是的量化相关性。
2、做递归,对数据进行建模,将某些变量放入递归。递归的一个假设就是这些变量彼此独立,如果任何两个变量彼此高度相关,实际上难以判断哪个变量产生的这种现象。
3、重要的一点是,首先衡量变量之间的相关性。通常可以帮助你确认哪些变量不要一起投入。可以帮助你判断,实际上报保留哪些变量。
4、相关性可能也存在欺骗性。


 1万+
1万+

 被折叠的 条评论
为什么被折叠?
被折叠的 条评论
为什么被折叠?
 到【灌水乐园】发言


