


 这篇博客介绍了如何在Android设备或模拟器上使用Visual Studio的"调试日志"工具查看和分析logcat日志,包括如何打开工具、设备选择、日志过滤以及如何通过Android.Util.Log类写入调试日志。
Android 调试日志Android Debug Log
06/22/2018
本文内容
开发人员用于调试应用程序的一个非常常见的技巧是调用 Console.WriteLine。One very common trick developers use to debug their applications is to make calls to Console.WriteLine. 但是,在移动平台(如 Android)上没有控制台。However, on a mobile platform like Android there is no console. Android 设备会提供日志,可以在编写应用时使用。Android devices provides a log that you can use while writing apps. 这有时称为“logcat” ,原因在于为检索它而输入的命令。This is sometimes referred to as logcat due to the command that you type to retrieve it. 使用“调试日志” 工具,可查看记录的数据。Use the Debug Log tool to view the logged data.
Android 调试日志概述Android Debug Log Overview
“调试日志” 工具使你能够在通过 Visual Studio 调试应用时查看日志输出。The Debug Log tool provides a way to view log output while debugging an app through Visual Studio. 调试日志支持以下设备:The debug log supports the following devices:
物理 Android 手机、平板电脑和可穿戴设备。Physical Android phones, tablets, and wearables.
在 Android Emulator 上运行的 Android 虚拟设备。An Android Virtual device running on the Android Emulator.
备注
“调试日志” 工具并不适用于 Xamarin Live Player。The Debug Log tool does not work with Xamarin Live Player.
“调试日志” 不会显示在设备上独立运行应用时生成的日志消息(即,在从 Visual Studio 断开连接时)。The Debug Log does not display log messages that are generated while the app is running standalone on the device (i.e., while it is disconnected from Visual Studio).
从 Visual Studio 访问调试日志Accessing the Debug Log from Visual Studio
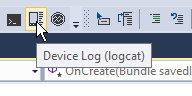
若要打开“设备日志” 工具,单击工具栏上的“设备日志 (logcat)” 图标:To open the Device Log tool, click Device Log (logcat) icon on the toolbar:
或者,也可以从以下菜单选项之一启动“设备日志” 工具:Alternately, launch the Device Log tool from one of the following menu selections:
“视图”>“其他窗口”>“设备日志”View > Other Windows > Device Log
“工具”>“Android”>“设备日志”Tools > Android > Device Log
下面的屏幕截图演示了“调试工具” 窗口的各个部分:The following screenshot illustrates the various parts of the Debug Tool window:
 最低0.47元/天 解锁文章


 562
562

 被折叠的 条评论
为什么被折叠?
被折叠的 条评论
为什么被折叠?
 到【灌水乐园】发言


