


 本文介绍了两种融合蛋白——antiCD3Fv-⊿IL3和ds-antiCD3Fv-⊿IL3的构建与表达。通过基因序列验证和细菌表达系统,成功表达了这两种融合蛋白,并通过疏水性和分子间力形成稳定的结构。实验结果显示,这两者均能有效结合CD3阳性和CD123阳性细胞,且ds-antiCD3Fv-⊿IL3通过二硫键连接,稳定性更优。在体外实验中,这些融合蛋白能够介导T细胞杀伤CD123阳性的白血病细胞,并抑制肿瘤生长。在小鼠异种移植模型中,ds-antiCD3Fv-⊿IL3表现出更强的抗肿瘤活性,为靶向治疗提供了可能性。
Construction and expression of fusion proteins antiCD3Fv-⊿IL3 and ds-antiCD3Fv-⊿IL3
The nucleotide sequences encoding the fusion proteins were verified by DNA sequencing. The last eight amino acids at the C-terminal of IL3 were entirely deleted. In addition, the Ser-100 of antiCD3VL and Gly-44 of antiCD3VH were successfully replaced by cysteines (Figure 1B). The fusion proteins were expressed by cosecretion of the two polypeptide chains (antiCD3VL-⊿IL3 or antiCD3*VL-⊿IL3 and antiCD3VH-⊿IL3-His or antiCD3*VH-⊿IL3-His) from Escherichia coli 16C9 cells as periplasmic native proteins (Figure 1A,B). Then, antiCD3VL-⊿IL3 and antiCD3VH-⊿IL3-His were folded to form fusion protein antiCD3Fv-⊿IL3 depending on the intermolecular force (Figure 1C) whereas the two cysteine-mutated polypeptide chains antiCD3*VL-⊿IL3 and antiCD3*VH-⊿IL3-His formed fusion protein ds-antiCD3Fv-⊿IL3 relying on the disulfide bonds in the periplasmic space (Figure 1D). The fusion proteins were released from the periplasmic space of E. coli by osmotic shock and purified by 6 × His-tag affinity chromatography. The yields of purified fusion proteins ranged from 1 to 2 mg/L of culture medium.
Figure 1
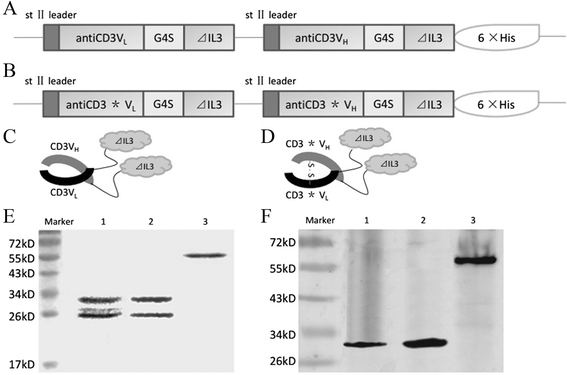
Expression and purification of the fusion proteins antiCD3Fv-⊿IL3 and the ds-antiCD3Fv-⊿IL3. Schematic of the expression plasmid for (A) antiCD3Fv-⊿IL3 and (B) ds-antiCD3Fv-⊿IL3, and structure of the fusion proteins for (C) antiCD3Fv-⊿IL3 and (D) ds-antiCD3Fv-⊿IL3. Note: the drawing is not to scale; asterisk (*) indicates the site of the disulfide bond. The fusion proteins were expressed in E. coli, purified by affinity chromatography, and analyzed by SDS-PAGE and immunoblotting. (E) Colloidal staining of a SDS-PAGE gel. Lane 1: antiCD3Fv-⊿IL3 in non-reducing loading buffer; lane 2: ds-antiCD3Fv-⊿IL3 in reducing loading buffer; lane 3: ds-antiCD3Fv-⊿IL3 in non-reducing loading buffer. (F) Immunoblot analysis of the SDS-PAGE gel with an anti-His-tag antibody. Lane 1: antiCD3Fv-⊿IL3 in non-reducing loading buffer; lane 2: ds-antiCD3Fv-⊿IL3 in reducing loading buffer; lane 3: ds-antiCD3Fv-⊿IL3 in non-reducing loading buffer.
The purified fusion proteins were analyzed by SDS-PAGE and Western blot. The fusion protein antiCD3Fv-⊿IL3 was resolved under electrophoretic conditions and detected as two bands of approximately 30 and 27 kD, corresponding to the two polypeptide chains of antiCD3VH-⊿IL3 and antiCD3VL-⊿IL3, respectively, as anticipated (Figure 1E). Under reducing conditions, the fusion protein ds-antiCD3Fv-⊿IL3 was resolved into two proteins bands consistent with those of antiCD3Fv-⊿IL3. However, under non-reducing conditions, the fusion protein ds-antiCD3Fv-⊿IL3 was detected as one band at approximately 57 kD (Figure 1E). Western blot analysis using an anti-His-tag antibody validated the existence of the His-tag-containing fragment and confirmed that the two polypeptide chains of antiCD3*VL-⊿IL3 and antiCD3*VH-⊿IL3 were linked by the disulfide bond (Figure 1F).
Dual specificity of the fusion proteins antiCD3Fv-⊿IL3 and ds-antiCD3Fv-⊿IL3
Both antiCD3Fv-⊿IL3 and ds-antiCD3Fv-⊿IL3 bind to CD123-positive KG1a cells and CD3-positive Jurkat cells with similar efficiency as their parental monoclonal antibodies CD123 and HIT3a to the respective target cells (Figure 2A,B,E,F). Furthermore, both fusion proteins were able to partly reduce the binding efficiency of the parental monoclonal antibodies HIT3a and CD123 McAb to Jurkat and KG1a, respectively, in a competitive binding assay (Figure 2C,D,G,H). No significant decrease in binding activity of ds-antiCD3Fv-⊿IL3 fusion protein was detected compared to the parental fusion protein antiCD3Fv-⊿IL3.
Figure 2
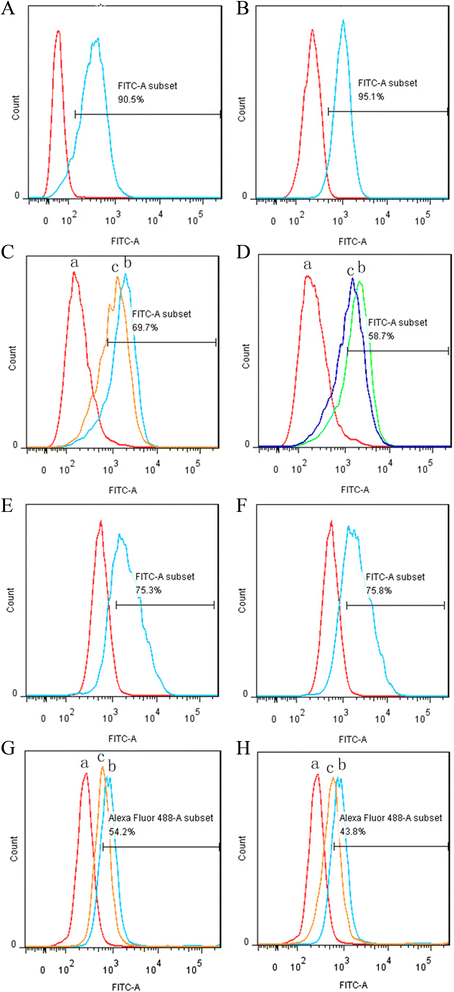
Analysis of specific binding of fusion proteins antiCD3Fv-⊿IL3 and ds-antiCD3Fv-⊿IL3 to Jurkat and KG1a, as well as the competitive binding activity with monoclonal antibody HIT3a or CD123. (A, B) Jurkat cells were incubated with fusion proteins (A) antiCD3Fv-⊿IL3 or (B) ds-antiCD3Fv-⊿IL3. (E-F) KG1a cells were incubated with (E) antiCD3Fv-⊿IL3 or (F) ds-antiCD3Fv-⊿IL3. Note: the gate represented the positive rate of binding of fusion proteins. In the competitive binding assay, (C, D) Jurkat cells were first incubated with ((C): c) antiCD3Fv-⊿IL3 or ((D): c) ds-antiCD3Fv-⊿IL3 and HIT3a. (G, H) KG1a cells were first incubated with ((G): c) antiCD3Fv-⊿IL3 or ((H): c) ds-antiCD3Fv-⊿IL3 and mAb CD123, then incubated with an FITC-conjugated antimouse IgG. Control groups only reacted with (a.) PBS and (b.) parent mAb IgG. Note: the gate represented the binding rate of the line of c with monoclonal antibody HIT3a or CD123.
Stability of fusion proteins antiCD3Fv-⊿IL3 and ds-antiCD3Fv-⊿IL3 in vitro
The stability of the fusion proteins in vitro was determined by analysis of their binding to target cells after incubation in PBS containing 0.2% (w/v) human serum albumin (HSA) at 37°C for several hours. The results showed that the binding capacity of the fusion proteins antiCD3Fv-⊿IL3 was reduced by nearly 50% after incubation for 6 h and 80% for 72 h, while the binding capacity of the ds-antiCD3Fv-⊿IL3 remained more than 90% after 72 h (Figure 3A,B).
Figure 3
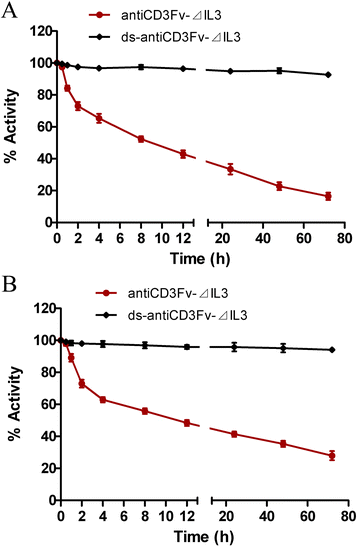
Comparison of the stability of fusion proteins antiCD3Fv-⊿IL3 and ds-antiCD3Fv-⊿IL3
in vitro
. The stability was determined by testing binding activity of fusion proteins to (A) CD3-positive Jurkat cells or (B) CD123-positive KG1a cells after incubation in 0.2% HSA at 37°C for a prolonged time period. Data were normalized to t
0 (initial time), which was set at 100%. The data shown represent the averages of three independent experiments.
Tumor cell lysis mediated by fusion proteins antiCD3Fv-⊿IL3 and ds-antiCD3Fv-⊿IL3
A non-radioactive cytotoxicity assay was performed to determine the ability of the fusion proteins antiCD3Fv-⊿IL3 and ds-antiCD3Fv-⊿IL3 to induce lysis of CD123+ tumor cells in the presence of pre-activated human T cells. The fusion proteins antiCD3Fv-⊿IL3 and ds-antiCD3Fv-⊿IL3 appeared to be potent in retargeting T cell lysis of the CD123-positive KG1a cells (Figure 4A,B,C), whereas CD123-negative cells THP1 and NB4 were not lysed under the same conditions (Figure 4D,E). Correspondingly, the ratio of apoptotic cells in the group of antiCD3Fv-⊿IL3 (65.633% ± 3.807%) and ds-antiCD3Fv-⊿IL3 (67.733% ± 3.821%) were increased when combined with pre-activated human T cells (Figure 4F,G). Additional movie files show this process of target cell lysis in more detail (see Additional file 1: Movie 1, Additional file 2: Movie 2, Additional file 3: Figure S1, and Additional file 4: Figure S2). Lysis of target cells mediated by the fusion protein or ds fusion protein increased in a dose-dependent manner: increasing either the concentration of fusion proteins or the ratio of effector to target cells resulted in enhanced target cell cytotoxicity (Figure 4A,B). The cytotoxic activity was not enhanced when an equal amount of the antiCD3/antiCD19 diabody was added, because CD19 was not expressed on the KG1a cells (Figure 4C). There was no statistical difference between the parental fusion protein and the ds fusion protein (500 ng/mL) in mediating the lysis of KG1a cells at various E:T ratios (Figure 4C).
Figure 4
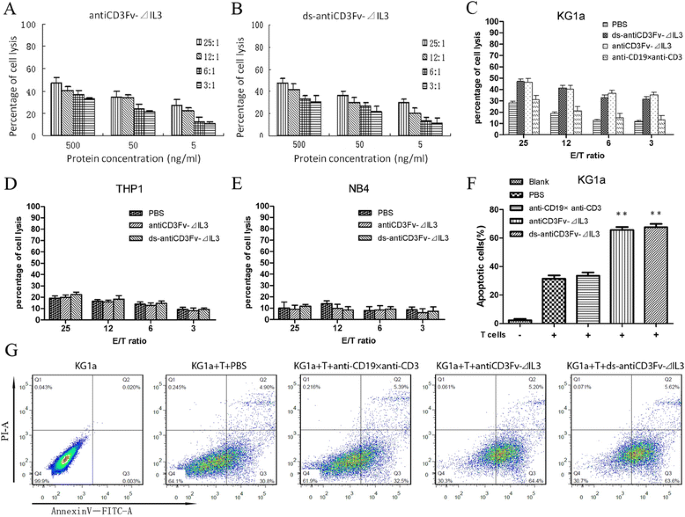
Cytotoxicity of IL2 pre-activated human T cells to KG1a cells in different effector to target (E/T) ratios mediated by different concentrations of fusion proteins in a non-radioactive cytotoxicity assay. (A) Cytotoxicity of T cells in the presence of antiCD3Fv-⊿IL3. (B) Cytotoxicity of T cells in the presence of ds-antiCD3Fv-⊿IL3. Concentrations of fusion proteins were different (500, 50, 5 ng/mL). E/T cell ratios ranged from 25:1 to 3:1. (C) Lysis of target cells by T cells mediated by PBS, ds-antiCD3Fv-⊿IL3, antiCD3Fv-⊿IL3, and the control diabody antiCD19 × antiCD3. The concentration of all fusion proteins was 500 ng/mL. CD123-negative cell line (D) THP1 and (E) NB4 were included as a control. (F, G) Ratios of apoptotic cells mediated by fusion proteins (500 ng/mL) combined with pre-activated T cells at E/T ratio of 25:1. PBS and antiCD19 × antiCD3 are used as a control. **P
Cytotoxicity of T cells mediated by the fusion proteins against AML leukemic progenitors
The peripheral blood mononuclear cells from six newly diagnosed AML patients were incubated in serum-free IMDM for 24 h in the presence or absence of different fusion proteins combined with pre-activated T cells. Treated and untreated cells were then plated in AML-colony-forming cell (CFC) assays to evaluate the relative cytotoxicity of T cells mediated by the fusion proteins against these leukemic progenitors. AML-CFCs were detected in control (including PBS-treated or fusion proteins without pre-activated T cells) cultures of all six AML samples, ranging from 112 to 490 AML-CFCs/104 cells (Figure 5A,B,C,D). After 24-h exposure to fusion proteins with pre-activated T cells, the mean percentages of kill of AML-CFCs were 53.3% and 52.8%, respectively, for antiCD3Fv-⊿IL3 and ds-antiCD3Fv-⊿IL3, (range, 33.9% ~ 63.4%) (Figure 5A,E,F). There was no statistical difference between the parental fusion protein and the ds fusion protein (500 ng/mL) in mediating the inhibition of colony formation of AML leukemic progenitors in vitro (Figure 5A). These findings indicate that the two fusion proteins can preferentially retarget T cells to AML progenitor cells.
Figure 5
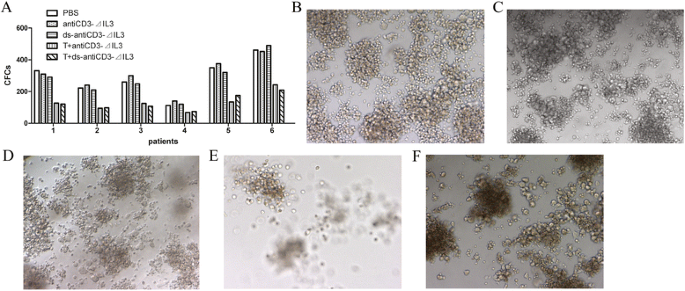
Cytotoxicity of IL2 pre-activated human T cells mediated by the fusion proteins against AML leukemic progenitors in a methylcellulose colony-forming assay. (A) AML cells from six patients were incubated in serum-free IMDM for 24 h in the presence or absence of different fusion proteins (500 ng/mL) combined with pre-activated T cells at E/T ratio of 25:1, then plated in AML-CFC assays to evaluate the relative cytotoxicity of T cells mediated by the fusion proteins against these leukemic progenitors. (B-F) showed typical colonies of different groups. (B) PBS, (C) antiCD3Fv-⊿IL3, or (D) ds-antiCD3Fv-⊿IL3 alone was used as control group. (E) Cytotoxicity of T cells against leukemic progenitors in the presence of antiCD3Fv-⊿IL3. (F) Cytotoxicity of T cells against leukemic progenitors in the presence of ds-antiCD3Fv-⊿IL3.
Inhibition of growth of human KG1a xenografts in vivo
We established a NOD/SCID mouse model bearing the human AML progenitor cell line KG1a to determine whether the fusion proteins also had an antitumor activity in vivo. The pathological finding showed KG1a tumor cells were in diffuse and intensive distribution, which indicated the subcutaneous KG1a xenotransplanted model was established successfully (Figure 6A). The expression level of CD123 on the surface of KG1a xenografts (70.620% ± 5.023%) was slightly reduced compared with KG1a cell line (77.875% ± 3.090%) (Figure 6B). Two doses (50 and 100 μg/mouse) of the fusion proteins were chosen to evaluate their ability to inhibit tumor growth in NOD/SCID mice. Animals were sacrificed when the tumors had grown to approximately 4,000 mm3 in size. As shown in Figure 6C, compared to the mice in the control group (untreated), the mice treated with different dosages of fusion proteins antiCD3Fv-⊿IL3 or ds-antiCD3Fv-⊿IL3 combined with pre-activated T lymphocytes showed a significant dose-related tumor regression. Furthermore, the ds fusion protein had a better antitumor activity than the parental fusion protein, when equivalent doses of ds fusion protein and the parent fusion protein were compared. The ability of tumor regression still exceeded its parental fusion protein slightly, even with half dose of the ds fusion protein (Figure 6C).
Figure 6
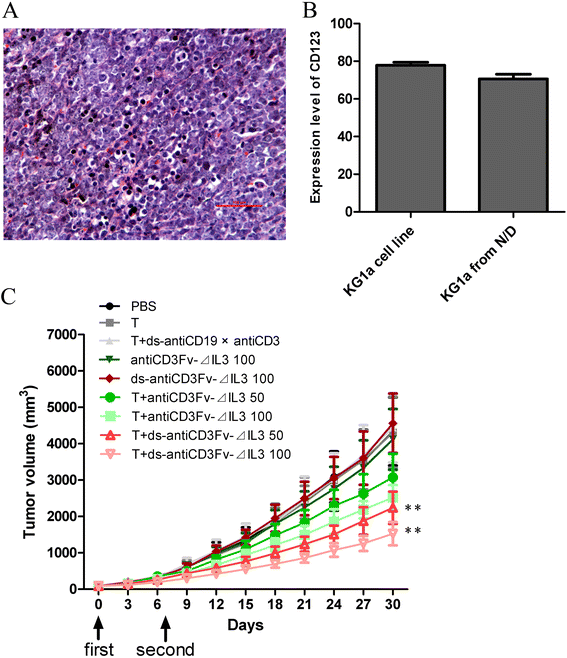
Antitumor effect of fusion proteins antiCD3Fv-⊿IL3 and ds-antiCD3Fv-⊿IL3 in KG1a xenografted NOD/SCID mice. (A) H&E staining showed the KG1a tumor cells were diffused and in intensive distribution, indicating subcutaneous KG1a xenotransplanted model was established successfully. (B) The expression level of CD123 on the surface of KG1a xenografts and KG1a cell line were analyzed by FACS. (C) A mixture of T cells and fusion proteins antiCD3Fv-⊿IL3 or ds-antiCD3Fv-⊿IL3 in different concentrations (50 and 100 μg/mouse) were injected intravenously 6 days later, when the solid tumors reached 80–100 mm3 in size, once per week for 2 weeks. PBS, antiCD3Fv-⊿IL3, ds-antiCD3Fv-⊿IL3, and T cells alone, and T cells combined with antiCD19 × antiCD3 diabody, were used as control groups. The size of the xenografts was measured every 3 days. Error bars indicate SD (n = 5). **P


 被折叠的 条评论
为什么被折叠?
被折叠的 条评论
为什么被折叠?
 到【灌水乐园】发言


