


1. Python的figure参数主要有:
def figure(num=None, # autoincrement if None, else integer from 1-N
figsize=None, # defaults to rc figure.figsize
dpi=None, # defaults to rc figure.dpi
facecolor=None, # defaults to rc figure.facecolor
edgecolor=None, # defaults to rc figure.edgecolor
frameon=True,
FigureClass=Figure,
clear=False,
**kwargs
):
可以设置图片大小、分辨率、颜色等。
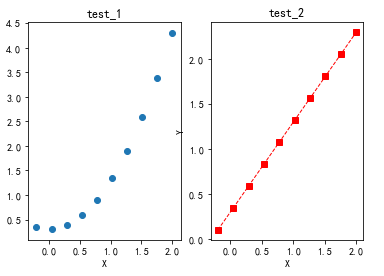
2. subplot子图绘制,子图的绘图参数可以分别设置
plt.figure(1)
x1 = np.linspace(-0.2, 2, 10)
y1 = x1**2 + 0.3
plt.subplot(121)
plt.scatter(x1, y1)
plt.xlabel('X')
plt.ylabel('Y')
plt.title('test_1')
x2 = np.linspace(-0.2, 2, 10)
y2 = x2 + 0.3
plt.subplot(122)
plt.plot(x2, y2, color="red", linewidth=1.0, marker = 's', linestyle="--")
## plt.plot(x, y, color="#ef5492", linewidth=2.0, marker = 's', linestyle="--")
# plt.plot(x2, y2, 'rs--')
plt.xlabel('X')
plt.ylabel('Y')
plt.title('test_2')
plt.show()
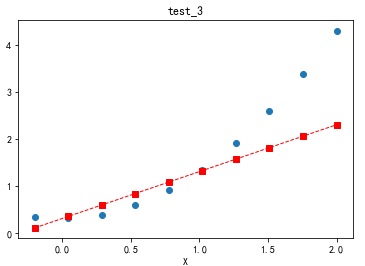
3. 在同一张图片上显示多种图形,简单说把 plt.show()放在最后即可
import matplotlib.pyplot as plt
import numpy as np
plt.figure(2)
x1 = np.linspace(-0.2, 2, 10)
y1 = x1**2 + 0.3
plt.scatter(x1, y1)
x2 = np.linspace(-0.2, 2, 10)
y2 = x2 + 0.3
plt.plot(x2, y2, color="red", linewidth=1.0, marker = 's', linestyle="--")
## plt.plot(x, y, color="#ef5492", linewidth=2.0, marker = 's', linestyle="--")
# plt.plot(x2, y2, 'rs--')
plt.xlabel('X')
plt.ylabel('Y')
plt.title('test_3')
plt.show()
以上就是本文的全部内容,希望对大家的学习有所帮助,也希望大家多多支持脚本之家。


 被折叠的 条评论
为什么被折叠?
被折叠的 条评论
为什么被折叠?
 到【灌水乐园】发言


