


 本文详细介绍如何下载并安装Elasticsearch、Logstash及Kibana(即ELK堆栈)。通过逐步指导设置过程,包括配置环境以启动Elasticsearch服务、创建Logstash配置文件以读取指定的日志文件,并通过过滤器进行数据解析,最后设置Kibana以展示收集的数据。

1.下载:
1. Elasticsearch: wget https://download.elastic.co/elasticsearch/release/org/elasticsearch/distribution/tar/elasticsearch/2.3.3/elasticsearch-2.3.3.tar.gz
2. Logtash:wget https://download.elastic.co/logstash/logstash/logstash-2.3.2.tar.gz
3. Kibana: wget https://download.elastic.co/kibana/kibana/kibana-4.5.1-linux-x64.tar.gz
2.安装(3个软件都是解压即可使用)
1:首先Elasticsearch,需要Jdk环境(这里省略...),以非root用户启动,要不会报错。
cd elasticsearch-2.3.3
bin/elasticsearch -d (后台启动)
2:Logtash
在根目录创建logtash.conf文件(用此文件来启动)
input {
    file {
        path => "/usr/local/nginx/logs/access.log" #你的日志文件
        start_position => beginning
        ignore_older => 0
    }
}

filter {

     grok {
        match => { "message" => "%{COMBINEDAPACHELOG}"}
     }
     geoip {
        source => "clientip"
     }
}

output {
     elasticsearch {
        hosts => ["localhost:9200"]
        index => "logstash-%{+YYYY.MM.dd}"
     }
}
启动logtash:bin/logstash -f logstash.conf 
出现这个启动成功
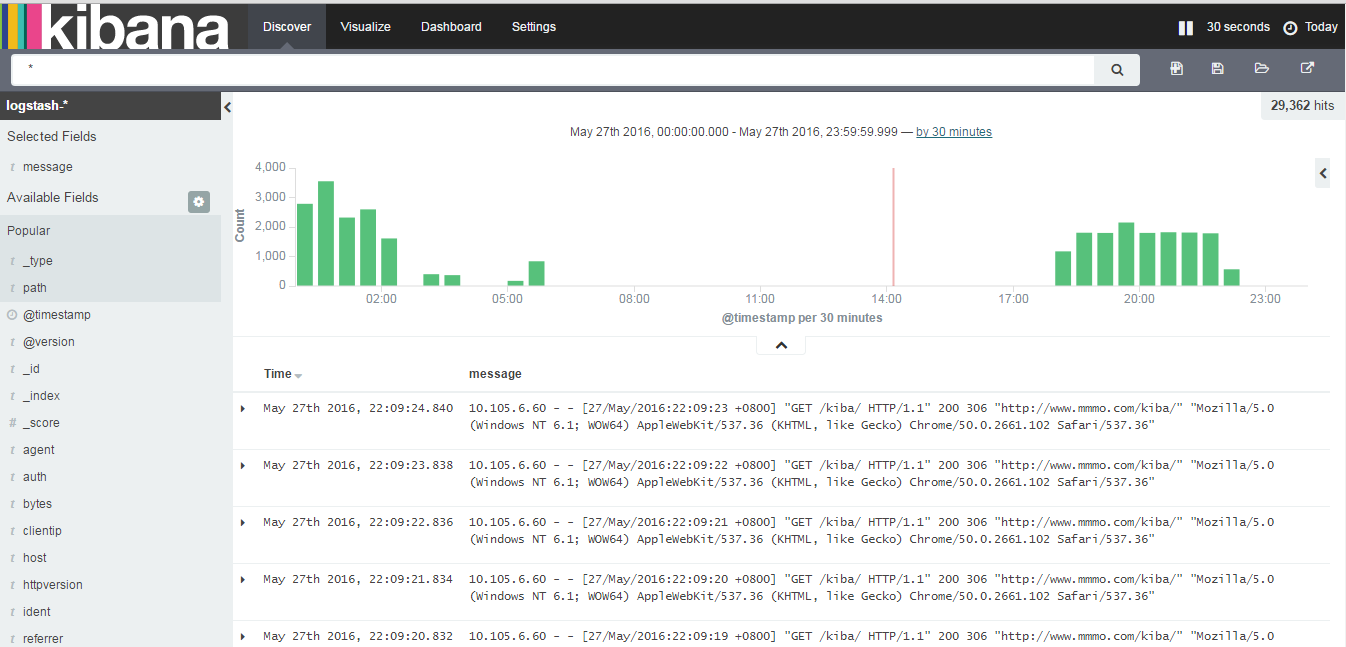
3.Kibana
编辑conf下的kibana.yml 改成你的host.
elasticsearch.url: "http://localhost:9200"然后启动Kibana:
bin/kibana

访问上边的复制最后一行去访问就可以了。默认端口是5601


 9823
9823

 被折叠的 条评论
为什么被折叠?
被折叠的 条评论
为什么被折叠?
 到【灌水乐园】发言


