


 本文详细介绍了如何从单一的Kafka broker扩展到多broker集群的过程,并演示了如何通过增加更多的broker实例来设置多节点集群。此外,还介绍了如何创建复制因子为3的主题,并展示了如何查看主题详情以及进行消息生产和消费。最后,通过模拟故障转移,验证了Kafka集群的高可用性。
一切来源于官网
http://kafka.apache.org/documentation/
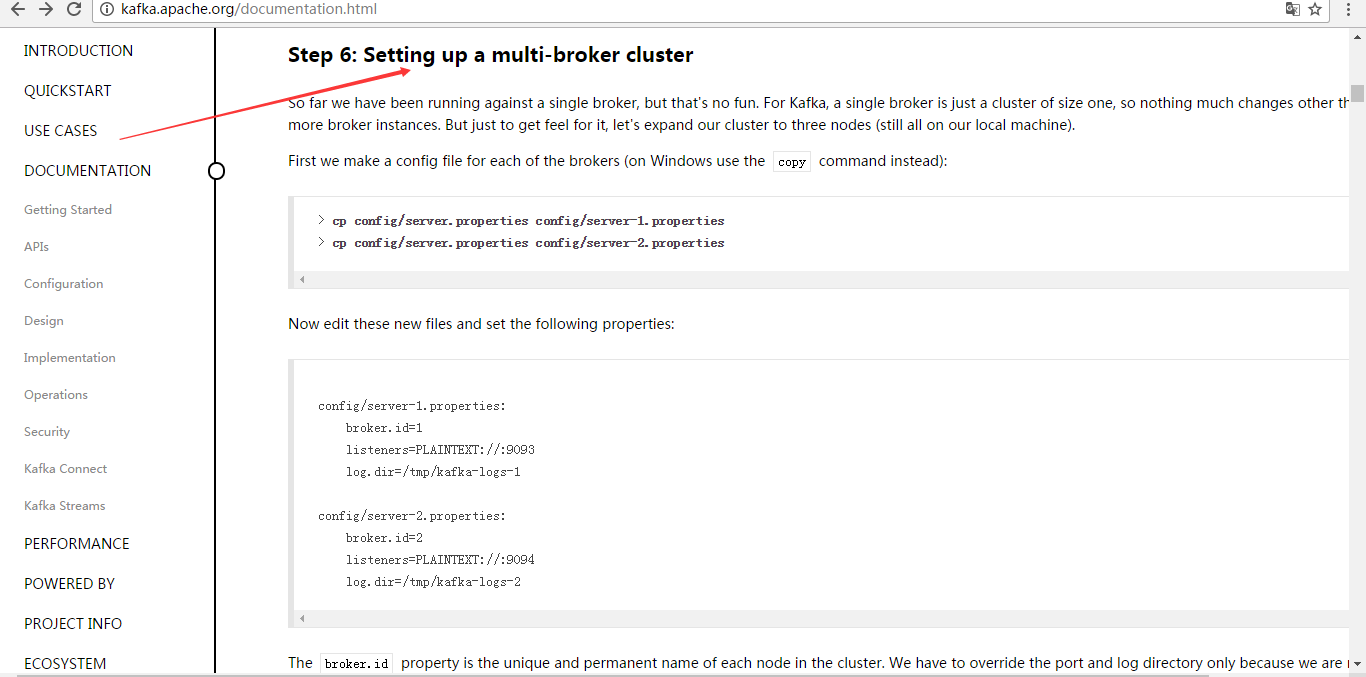
Step 6: Setting up a multi-broker cluster
Step 6: 设置多个broker集群
So far we have been running against a single broker, but that's no fun. For Kafka, a single broker is just a cluster of size one, so nothing much changes other than starting a few more broker instances. But just to get feel for it, let's expand our cluster to three nodes (still all on our local machine).
到目前,我们只是单一的运行一个broker,,没什么意思。对于Kafka,一个broker仅仅只是一个集群的大小, 所有让我们多设几个broker.
First we make a config file for each of the brokers (on Windows use the copy command instead):
首先为每个broker创建一个配置文件:
> cp config/server.properties   config/server-1.properties
> cp config/server.properties   config/server-2.properties
Now edit these new files and set the following properties:
现在编辑这些新建的文件,设置以下属性:
config/server-1.properties:
    broker.id=1
    listeners=PLAINTEXT://:9093
    log.dir=/tmp/kafka-logs-1

config/server-2.properties:
    broker.id=2
    listeners=PLAINTEXT://:9094
    log.dir=/tmp/kafka-logs-2
The broker.id property is the unique and permanent name of each node in the cluster. We have to override the port and log directory only because we are running these all on the same machine and we want to keep the brokers from all trying to register on the same port or overwrite each other's data.
broker.id是集群中每个节点的唯一且永久的名称,我们修改端口和日志分区是因为我们现在在同一台机器上运行,我们要防止broker在同一端口上注册和覆盖对方的数据。
We already have Zookeeper and our single node started, so we just need to start the two new nodes:
我们已经运行了zookeeper和刚才的一个kafka节点,所有我们只需要再启动2个新的kafka节点。
> bin/kafka-server-start.sh config/server-1.properties &
...
> bin/kafka-server-start.sh config/server-2.properties &
...
Now create a new topic with a replication factor of three:
现在,我们创建一个新topic,把备份设置为:3
> bin/kafka-topics.sh --create --zookeeper localhost:2181 --replication-factor 3 --partitions 1 --topic my-replicated-topic
Okay but now that we have a cluster how can we know which broker is doing what? To see that run the "describe topics" command:
好了,现在我们已经有了一个集群了,我们怎么知道每个集群在做什么呢?运行命令“describe topics”
这是查看topic详情
> bin/kafka-topics.sh --describe --zookeeper localhost:2181 --topic my-replicated-topic
Topic:my-replicated-topic	PartitionCount:1	ReplicationFactor:3	Configs:
	Topic: my-replicated-topic	Partition: 0	Leader: 1	Replicas: 1,2,0	Isr: 1,2,0
Here is an explanation of output. The first line gives a summary of all the partitions, each additional line gives information about one partition. Since we have only one partition for this topic there is only one line.
这是一个解释输出,第一行是所有分区的摘要,每一个线提供一个分区信息,因为我们只有一个分区,所有只有一条线。
- "leader" is the node responsible for all reads and writes for the given partition. Each node will be the leader for a randomly selected portion of the partitions.
- "replicas" is the list of nodes that replicate the log for this partition regardless of whether they are the leader or even if they are currently alive.
- "isr" is the set of "in-sync" replicas. This is the subset of the replicas list that is currently alive and caught-up to the leader.
"leader":该节点负责所有指定分区的读和写,每个节点的领导都是随机选择的。
"replicas":备份的节点,无论该节点是否是leader或者目前是否还活着,只是显示。
"isr":备份节点的集合,也就是活着的节点集合。
Note that in my example node 1 is the leader for the only partition of the topic.
We can run the same command on the original topic we created to see where it is:
我们运行这个命令,看看一开始我们创建的那个节点:
> bin/kafka-topics.sh --describe --zookeeper localhost:2181 --topic test
Topic:test	PartitionCount:1	ReplicationFactor:1	Configs:
	Topic: test	Partition: 0	Leader: 0	Replicas: 0	Isr: 0
So there is no surprise there—the original topic has no replicas and is on server 0, the only server in our cluster when we created it.
没有惊喜,刚才创建的topic(主题)没有Replicas,所以是0。
Let's publish a few messages to our new topic:
让我们来发布一些信息在新的topic上:
> bin/kafka-console-producer.sh --broker-list localhost:9092 --topic my-replicated-topic
...
my test message 1
my test message 2
^C
Now let's consume these messages:
现在,消费这些消息。
> bin/kafka-console-consumer.sh --bootstrap-server localhost:9092 --from-beginning --topic my-replicated-topic
...
my test message 1
my test message 2
^C
Now let's test out fault-tolerance. Broker 1 was acting as the leader so let's kill it:
我们要测试集群的容错,kill掉leader,Broker1作为当前的leader,也就是kill掉Broker1。
> ps aux | grep server-1.properties
7564 ttys002    0:15.91 /System/Library/Frameworks/JavaVM.framework/Versions/1.8/Home/bin/java...
> kill -9 7564
On Windows use:(不推荐大家用)
> wmic process get processid,caption,commandline | find "java.exe" | find "server-1.properties"
java.exe    java  -Xmx1G -Xms1G -server -XX:+UseG1GC ... build\libs\kafka_2.10-0.10.2.0.jar"  kafka.Kafka config\server-1.properties    644
> taskkill /pid 644 /f
Leadership has switched to one of the slaves and node 1 is no longer in the in-sync replica set:
备份节点之一成为新的leader,而broker1已经不在同步备份集合里了。
> bin/kafka-topics.sh --describe --zookeeper localhost:2181 --topic my-replicated-topic
Topic:my-replicated-topic	PartitionCount:1	ReplicationFactor:3	Configs:
	Topic: my-replicated-topic	Partition: 0	Leader: 2	Replicas: 1,2,0	Isr: 2,0
But the messages are still available for consumption even though the leader that took the writes originally is down:
但是,消息仍然没丢:
> bin/kafka-console-consumer.sh --bootstrap-server localhost:9092 --from-beginning --topic my-replicated-topic
...
my test message 1
my test message 2
^C
本文转自大数据躺过的坑博客园博客,原文链接:http://www.cnblogs.com/zlslch/p/6767326.html,如需转载请自行联系原作者


 1万+
1万+

 被折叠的 条评论
为什么被折叠?
被折叠的 条评论
为什么被折叠?
 到【灌水乐园】发言


