


 本文介绍了EChart的基本使用方法,并通过柱状图、折线图和饼图等示例展示了如何利用JavaEChart插件在后端构造图表数据。EChart是一款由百度开发的JavaScript图表库,能够帮助开发者轻松实现数据的可视化。
一、简介
EChart是百度开发的js图表软件,用它我们可以很方便地以图形化的方式对数据进行分析统计。该种方式js在页面动态拼接json数据,再进行渲染。这种方法的优点是,灵活,可以随时进行修改。缺点是js代码多,难以维护。此时我们可以Java EChart插件,在后端构造好option数据,最后在页面直接使用构造好的option数据,渲染效果。下载地址为:http://git.oschina.net/free/ECharts
EChart提供链式的调用方法,使用也比较方便。它依赖Google的gson包,gson下载地址为:https://github.com/google/gson 。gson与EChart加入项目依赖。
maven依赖如下:
<dependency>
  <groupId>com.github.abel533</groupId>
  <artifactId>ECharts</artifactId>
  <version>2.2.7</version>
</dependency>

<dependency>
    <groupId>com.google.code.gson</groupId>
    <artifactId>gson</artifactId>
    <version>2.5</version>
</dependency>
二、示例
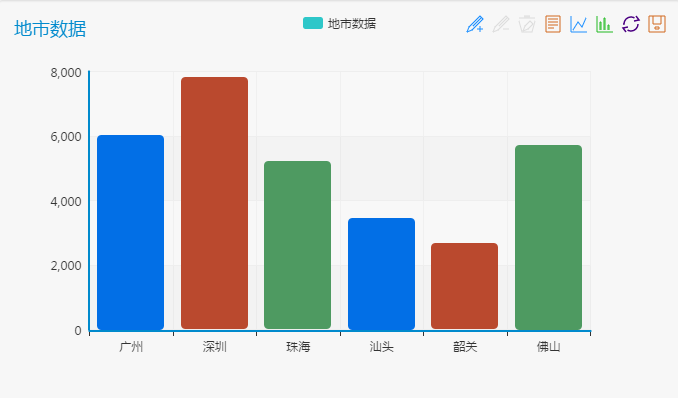
1、柱状图
 1     /**
 2      * 柱状图
 3      *
 4      * @param isHorizontal
 5      *            是否水平放置
 6      */
 7     public void testBar(boolean isHorizontal) {
 8         String[] citis = { "广州", "深圳", "珠海", "汕头", "韶关", "佛山" };
 9         int[] datas = { 6030, 7800, 5200, 3444, 2666, 5708 };
10         String[] colors = { "rgb(2,111,230)", "rgb(186,73,46)", "rgb(78,154,97)", "rgb(2,111,230)", "rgb(186,73,46)", "rgb(78,154,97)" };
11         String title = "地市数据";
12
13         GsonOption option = new GsonOption();
14
15         option.title(title); // 标题
16         // 工具栏
17         option.toolbox().show(true).feature(Tool.mark, // 辅助线
18                 Tool.dataView, // 数据视图
19                 new MagicType(Magic.line, Magic.bar),// 线图、柱状图切换
20                 Tool.restore,// 还原
21                 Tool.saveAsImage);// 保存为图片
22
23         option.tooltip().show(true).formatter("{a} <br/>{b} : {c}");//显示工具提示,设置提示格式
24
25         option.legend(title);// 图例
26
27         Bar bar = new Bar(title);// 图类别(柱状图)
28         CategoryAxis category = new CategoryAxis();// 轴分类
29         category.data(citis);// 轴数据类别
30         // 循环数据
31         for (int i = 0; i < citis.length; i++) {
32             int data = datas[i];
33             String color = colors[i];
34             // 类目对应的柱状图
35             Map<String, Object> map = new HashMap<String, Object>(2);
36             map.put("value", data);
37             map.put("itemStyle", new ItemStyle().normal(new Normal().color(color)));
38             bar.data(map);
39         }
40
41         if (isHorizontal) {// 横轴为类别、纵轴为值
42             option.xAxis(category);// x轴
43             option.yAxis(new ValueAxis());// y轴
44         } else {// 横轴为值、纵轴为类别
45             option.xAxis(new ValueAxis());// x轴
46             option.yAxis(category);// y轴
47         }
48
49         option.series(bar);
50     }
生成的json数据如下:


  1 {
  2   "title": {
  3     "text": "地市数据"
  4   },
  5   "toolbox": {
  6     "feature": {
  7       "mark": {
  8         "show": true,
  9         "title": {
 10           "mark": "辅助线开关",
 11           "markClear": "清空辅助线",
 12           "markUndo": "删除辅助线"
 13         },
 14         "lineStyle": {
 15           "color": "#1e90ff",
 16           "type": "dashed",
 17           "width": 2
 18         }
 19       },
 20       "dataView": {
 21         "show": true,
 22         "title": "数据视图",
 23         "readOnly": false,
 24         "lang": ["数据视图", "关闭", "刷新"]
 25       },
 26       "magicType": {
 27         "show": true,
 28         "title": {
 29           "line": "折线图切换",
 30           "stack": "堆积",
 31           "bar": "柱形图切换",
 32           "tiled": "平铺"
 33         },
 34         "type": ["line", "bar"]
 35       },
 36       "restore": {
 37         "show": true,
 38         "title": "还原"
 39       },
 40       "saveAsImage": {
 41         "show": true,
 42         "title": "保存为图片",
 43         "type": "png",
 44         "lang": ["点击保存"]
 45       }
 46     },
 47     "show": true
 48   },
 49   "tooltip": {
 50     "formatter": "{a} <br/>{b} : {c}",
 51     "show": true
 52   },
 53   "legend": {
 54     "data": ["地市数据"]
 55   },
 56   "xAxis": [{
 57     "type": "category",
 58     "data": ["广州", "深圳", "珠海", "汕头", "韶关", "佛山"]
 59   }],
 60   "yAxis": [{
 61     "type": "value"
 62   }],
 63   "series": [{
 64     "name": "地市数据",
 65     "type": "bar",
 66     "data": [{
 67       "value": 6030,
 68       "itemStyle": {
 69         "normal": {
 70           "color": "rgb(2,111,230)"
 71         }
 72       }
 73     }, {
 74       "value": 7800,
 75       "itemStyle": {
 76         "normal": {
 77           "color": "rgb(186,73,46)"
 78         }
 79       }
 80     }, {
 81       "value": 5200,
 82       "itemStyle": {
 83         "normal": {
 84           "color": "rgb(78,154,97)"
 85         }
 86       }
 87     }, {
 88       "value": 3444,
 89       "itemStyle": {
 90         "normal": {
 91           "color": "rgb(2,111,230)"
 92         }
 93       }
 94     }, {
 95       "value": 2666,
 96       "itemStyle": {
 97         "normal": {
 98           "color": "rgb(186,73,46)"
 99         }
100       }
101     }, {
102       "value": 5708,
103       "itemStyle": {
104         "normal": {
105           "color": "rgb(78,154,97)"
106         }
107       }
108     }]
109   }]
110 }
生成的图如下:
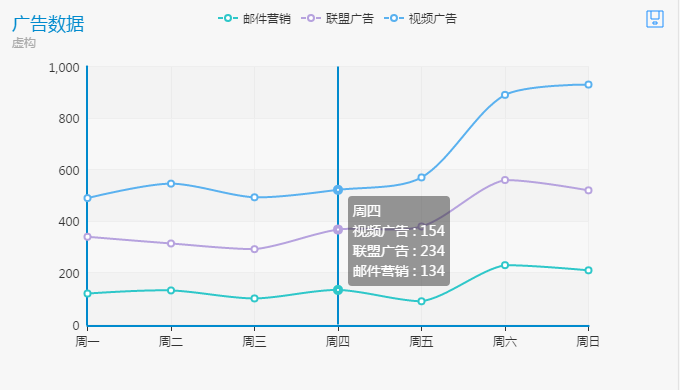
2、折线图
 1 /**
 2      * 折线图
 3      *
 4      * @param isHorizontal
 5      *            是否水平放置
 6      */
 7     public void testLine(boolean isHorizontal) {
 8         String[] types = { "邮件营销", "联盟广告", "视频广告" };
 9         int[][] datas = { { 120, 132, 101, 134, 90, 230, 210 }, { 220, 182, 191, 234, 290, 330, 310 }, { 150, 232, 201, 154, 190, 330, 410 } };
10         String title = "广告数据";
11
12         GsonOption option = new GsonOption();
13
14         option.title().text(title).subtext("虚构").x("left");// 大标题、小标题、位置
15
16         // 提示工具
17         option.tooltip().trigger(Trigger.axis);// 在轴上触发提示数据
18         // 工具栏
19         option.toolbox().show(true).feature(Tool.saveAsImage);// 显示保存为图片
20
21         option.legend(types);// 图例
22
23         CategoryAxis category = new CategoryAxis();// 轴分类
24         category.data("周一", "周二", "周三", "周四", "周五", "周六", "周日");
25         category.boundaryGap(false);// 起始和结束两端空白策略
26
27         // 循环数据
28         for (int i = 0; i < types.length; i++) {
29             Line line = new Line();// 三条线,三个对象
30             String type = types[i];
31             line.name(type).stack("总量");
32             for (int j = 0; j < datas[i].length; j++)
33                 line.data(datas[i][j]);
34             option.series(line);
35         }
36
37         if (isHorizontal) {// 横轴为类别、纵轴为值
38             option.xAxis(category);// x轴
39             option.yAxis(new ValueAxis());// y轴
40         } else {// 横轴为值、纵轴为类别
41             option.xAxis(new ValueAxis());// x轴
42             option.yAxis(category);// y轴
43         }
44
45     }
生成的json数据如下:
 1 {
 2   "title": {
 3     "text": "广告数据",
 4     "subtext": "虚构",
 5     "x": "left"
 6   },
 7   "toolbox": {
 8     "feature": {
 9       "saveAsImage": {
10         "show": true,
11         "title": "保存为图片",
12         "type": "png",
13         "lang": ["点击保存"]
14       }
15     },
16     "show": true
17   },
18   "tooltip": {
19     "trigger": "axis"
20   },
21   "legend": {
22     "data": ["邮件营销", "联盟广告", "视频广告"]
23   },
24   "xAxis": [{
25     "boundaryGap": false,
26     "type": "category",
27     "data": ["周一", "周二", "周三", "周四", "周五", "周六", "周日"]
28   }],
29   "yAxis": [{
30     "type": "value"
31   }],
32   "series": [{
33     "name": "邮件营销",
34     "type": "line",
35     "stack": "总量",
36     "data": [120, 132, 101, 134, 90, 230, 210]
37   }, {
38     "name": "联盟广告",
39     "type": "line",
40     "stack": "总量",
41     "data": [220, 182, 191, 234, 290, 330, 310]
42   }, {
43     "name": "视频广告",
44     "type": "line",
45     "stack": "总量",
46     "data": [150, 232, 201, 154, 190, 330, 410]
47   }]
48 }
生成的图如下:
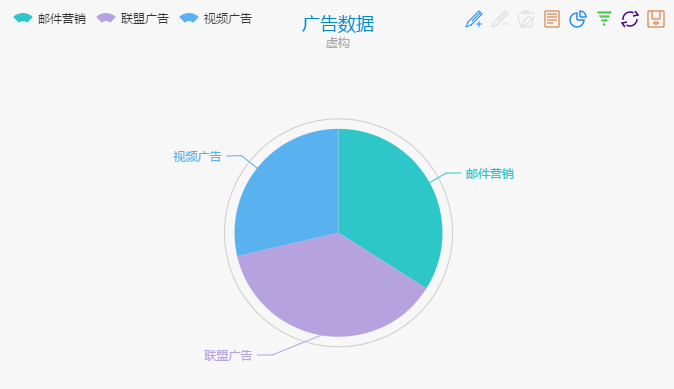
3、饼图
 1 /**
 2      *  饼图
 3      */
 4     public void testPie() {
 5         String[] types = { "邮件营销", "联盟广告", "视频广告" };
 6         int[] datas = { 120, 132, 101 };
 7         String title = "广告数据";
 8         GsonOption option = new GsonOption();
 9
10         option.title().text(title).subtext("虚构").x("center");// 大标题、小标题、标题位置
11
12         // 提示工具 鼠标在每一个数据项上,触发显示提示数据
13         option.tooltip().trigger(Trigger.item).formatter("{a} <br/>{b} : {c} ({d}%)");
14
15         // 工具栏
16         option.toolbox().show(true).feature(new Mark().show(true),// 辅助线
17                 new DataView().show(true).readOnly(false),// 数据视图
18                 new MagicType().show(true).type(new Magic[] { Magic.pie, Magic.funnel }), //饼图、漏斗图切换
19                 new Option().series(new Funnel().x("25%").width("50%").funnelAlign(X.left).max(1548)),// 漏斗图设置
20                 Tool.restore,// 还原
21                 Tool.saveAsImage);// 保存为图片
22
23         option.legend().orient(Orient.horizontal).x("left").data(types);// 图例及位置
24
25         option.calculable(true);// 拖动进行计算
26
27         Pie pie = new Pie();
28
29         // 标题、半径、位置
30         pie.name(title).radius("55%").center("50%", "60%");
31
32         // 循环数据
33         for (int i = 0; i < types.length; i++) {
34             Map<String, Object> map = new HashMap<String, Object>(2);
35             map.put("value", datas[i]);
36             map.put("name", types[i]);
37             pie.data(map);
38         }
39
40         option.series(pie);
41     }
生成的json数据如下:
 1 {
 2   "calculable": true,
 3   "title": {
 4     "text": "广告数据",
 5     "subtext": "虚构",
 6     "x": "center"
 7   },
 8   "toolbox": {
 9     "feature": {
10       "mark": {
11         "show": true,
12         "title": {
13           "mark": "辅助线开关",
14           "markClear": "清空辅助线",
15           "markUndo": "删除辅助线"
16         },
17         "lineStyle": {
18           "color": "#1e90ff",
19           "type": "dashed",
20           "width": 2
21         }
22       },
23       "dataView": {
24         "show": true,
25         "title": "数据视图",
26         "readOnly": false,
27         "lang": ["数据视图", "关闭", "刷新"]
28       },
29       "magicType": {
30         "show": true,
31         "title": {
32           "line": "折线图切换",
33           "stack": "堆积",
34           "bar": "柱形图切换",
35           "tiled": "平铺"
36         },
37         "type": ["pie", "funnel"]
38       },
39       "restore": {
40         "show": true,
41         "title": "还原"
42       },
43       "saveAsImage": {
44         "show": true,
45         "title": "保存为图片",
46         "type": "png",
47         "lang": ["点击保存"]
48       }
49     },
50     "show": true
51   },
52   "tooltip": {
53     "trigger": "item",
54     "formatter": "{a} <br/>{b} : {c} ({d}%)"
55   },
56   "legend": {
57     "orient": "horizontal",
58     "data": ["邮件营销", "联盟广告", "视频广告"],
59     "x": "left"
60   },
61   "series": [{
62     "center": ["50%", "60%"],
63     "radius": "55%",
64     "name": "广告数据",
65     "type": "pie",
66     "data": [{
67       "value": 120,
68       "name": "邮件营销"
69     }, {
70       "value": 132,
71       "name": "联盟广告"
72     }, {
73       "value": 101,
74       "name": "视频广告"
75     }]
76   }]
77 }
生成的图如下:


 1万+
1万+

 被折叠的 条评论
为什么被折叠?
被折叠的 条评论
为什么被折叠?
 到【灌水乐园】发言


