


 本文通过实例演示了如何使用Matplotlib进行绘图,包括设置标题、标签、文本注释及箭头等元素,并展示了不同样式的文本显示效果。
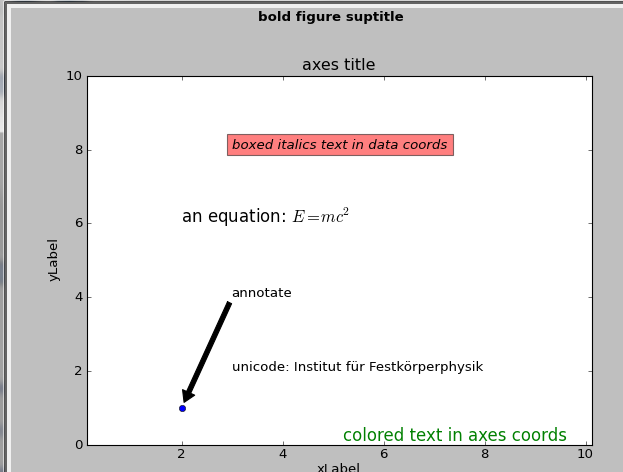
#coding=utf-8import matplotlib.pyplot as plt
fig=plt.figure("hello") #设置标题栏
fig.suptitle("bold figure suptitle",fontsize=12,fontweight="bold")
ax = fig.add_subplot(111)
fig.subplots_adjust(top=0.85)
ax.set_title('axes title')
ax.set_xlabel("xLabel")
ax.set_ylabel("yLabel")
ax.text(3,8,"boxed italics text in data coords",style="italic",bbox={'facecolor':'red', 'alpha':0.5, 'pad':10})
ax.text(2, 6, r'an equation: $E=mc^2$', fontsize=15)
ax.text(3, 2, unicode('unicode: Institut f\374r Festk\366rperphysik', 'latin-1'))
ax.text(0.95, 0.01, 'colored text in axes coords',
verticalalignment='bottom', horizontalalignment='right',
transform=ax.transAxes,
color='green', fontsize=15)
ax.plot([2], [1], 'o')
ax.annotate('annotate', xy=(2, 1), xytext=(3, 4),
arrowprops=dict(facecolor='black', shrink=0.05))
ax.axis([0, 15, 0, 10]) #坐标轴
plt.show() |
==============================================================================
本文转自被遗忘的博客园博客,原文链接:http://www.cnblogs.com/rollenholt/archive/2011/12/08/2281023.html,如需转载请自行联系原作者


 1276
1276

 被折叠的 条评论
为什么被折叠?
被折叠的 条评论
为什么被折叠?
 到【灌水乐园】发言


