


 本文介绍了一种从网页抓取电影票房数据的方法,并利用R语言进行了数据清洗和可视化,展示了2015年中国内地电影票房Top25的情况。


注:本文案例数据来自于艺恩电影营销智库
从网页抓取数据
方法一:使用XML包中的readHTMLTable函数抓取网页表格数据。
方法二:如果用的是chrome浏览器,可以安装一个名叫Table Capture的插件,自动抓取网页表格数据。通过粘贴板或者导入到google的电子表格并下载到本地后,将数据加载到R
本文使用方法一。在windows中,得到的数据会出现中文列变量名乱码(对列变量重新命名就好了,linux不会)。
library(XML)
library(ggplot2)

url <- "http://www.cbooo.cn/year?year=2015"
url <- htmlParse(url, encoding="UTF-8")#解析文件,需指定encoding为"UTF-8",否则乱码
tables <- readHTMLTable(url)
table <- tables[[1]]

head(table)

             排名:影片名 类型 总票房(万) 平均票价 场均人次 国家及地区   上映日期
1                1.捉妖记 魔幻       243952       37       42       中国 2015-07-16
2           2.速度与激情7 动作       242655       39       42  美国/日本 2015-04-12
3                  3.港囧 喜剧       161336       33       40       中国 2015-09-25
4 4.复仇者联盟2:奥创纪元 科幻       146438       40       29       美国 2015-05-12
5            5.夏洛特烦恼 喜剧       144145       32       34       中国 2015-09-30
6            6.侏罗纪世界 动作       142066       38       33       美国 2015-06-10
清洗并整理数据
names(table) <- c("title", "type", "boxoffice", "meanprice", "numofpeople", "nation", "date")
boxdf <- as.data.frame(lapply(table, as.character), stringsAsFactors=FALSE)
boxdf[,1] <- sub(pattern="\\d{1,2}.", replacement="", table[,1])

boxdf <- cbind(rank = 1:25,boxdf)
col1 <- c(3,7)
col2 <- 4:6
boxdf[, col1] <- lapply(boxdf[,col1], as.factor)
boxdf[, col2] <- sapply(boxdf[,col2], as.numeric)
可视化结果
现在,我们得到了一个25行8列的电影票房数据框。先查看下结构:
str(boxdf)

'data.frame':   25 obs. of  8 variables:
 $ rank       : int  1 2 3 4 5 6 7 8 9 10 ...
 $ title      : chr  "捉妖记" "速度与激情7" "港囧" "复仇者联盟2:奥创纪元" ...
 $ type       : Factor w/ 8 levels "剧情","动作",..: 8 2 4 7 4 2 5 4 2 3 ...
 $ boxoffice  : num  243952 242655 161336 146438 144145 ...
 $ meanprice  : num  37 39 33 40 32 38 36 33 39 35 ...
 $ numofpeople: num  42 42 40 29 34 33 45 39 37 34 ...
 $ nation     : Factor w/ 9 levels "中国","中国/中国香港",..: 1 8 1 5 1 5 1 1 1 1 ...
$ date : chr "2015-07-16" "2015-04-12" "2015-09-25" "2015-05-12" ...下面用ggplot2来可视化电影票房情况
ggplot(boxdf)+
geom_bar(aes(x=reorder(title, boxoffice), y=boxoffice, fill = "boxoffice"),
         position = "dodge",stat = "identity")+
   scale_fill_manual(values=c(boxoffice="#A6CEE3")) +
   coord_flip() +
   theme(axis.text.x = element_text(size = rel(2)),
         axis.text.y = element_text(size = rel(2)),
         plot.title=element_text(vjust=2,size=rel(2)),
         legend.title = element_text(size = 18)) +
   labs(x=NULL, y=NULL, title="2015年中国内地电影总票房Top25(单位:万)")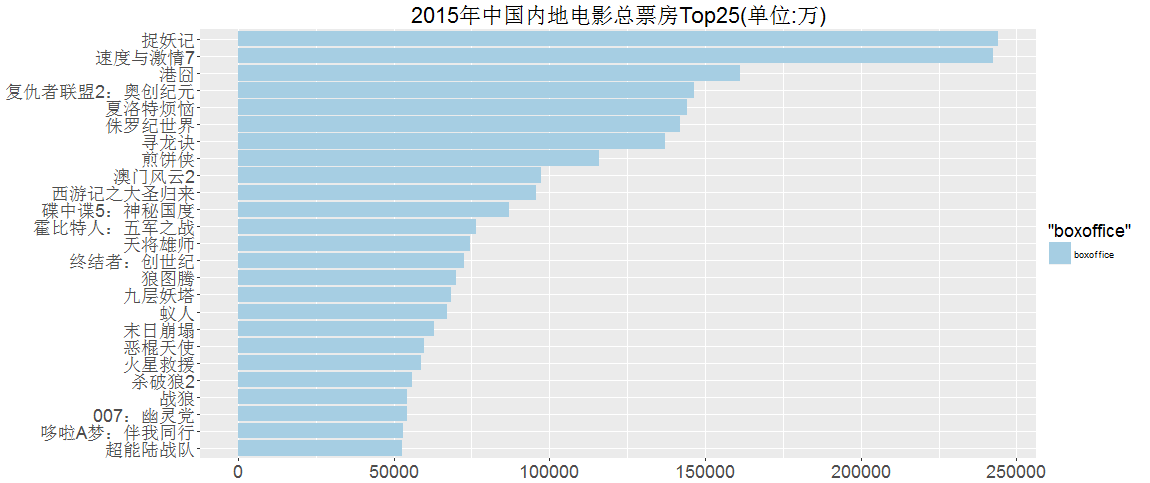
从下面的条形图可以看到观众最喜欢的三大电影类型依次是动作、科幻、喜剧。
typedata <- as.data.frame(table(boxdf$type))
names(typedata) <- c("type","number")
ggplot(typedata, aes(x=type, y =number, fill=type))+
geom_bar(position="dodge", stat="identity")+
geom_text(aes(label=number), hjust=0.5, vjust=-0.5, size=5) +
  theme(axis.title.x = element_text(colour="black", size=18),axis.text.x = element_text(size = rel(2)),
        axis.title.y = element_text(colour="black", size=18),axis.text.y = element_text(size = rel(2)),
        plot.title=element_text(vjust=2,size=rel(2)), legend.title=element_text(size=20)) +
  labs(x="电影类型",y="影片数", title="2015年中国内地电影票房Top25的电影类型分布")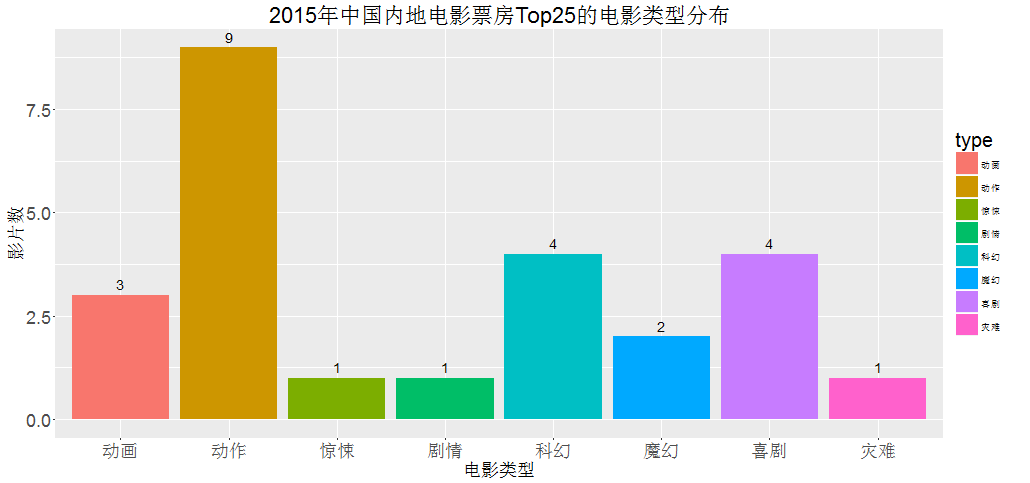
本文为雪晴数据网原创内容,作者温水根。转载请注明本文链接http://www.xueqing.cc/cms/article/115


 被折叠的 条评论
为什么被折叠?
被折叠的 条评论
为什么被折叠?
 到【灌水乐园】发言


