 MySQL从库崩溃故障排查


 本文记录了一次MySQL从库因内存不足、磁盘问题导致的频繁崩溃故障排查过程。通过分析日志、检查内存使用情况及磁盘空间,最终定位到坏硬盘并更换解决问题。

昨天搭建的一个从库今天一直报警,看了下日志,直接报了个 mysqld got signal 11,
具体日志如下:
2019-01-08T14:33:02.917330+08:00 14 [Note] Slave SQL thread for channel '' initialized, starting replication in log 'mysql-bin.000549' at position 6759798, relay log './relay-log.001654' position: 4
2019-01-08T14:33:02.917776+08:00 13 [Note] Slave I/O thread for channel '': connected to master 'repl@10.204.11.105:4001',replication started in log 'mysql-bin.000549' at position 6759798
06:08:58 UTC - mysqld got signal 11 ;
This could be because you hit a bug. It is also possible that this binary
or one of the libraries it was linked against is corrupt, improperly built,
or misconfigured. This error can also be caused by malfunctioning hardware.
Attempting to collect some information that could help diagnose the problem.
As this is a crash and something is definitely wrong, the information
collection process might fail.
Please help us make Percona Server better by reporting any
bugs at http://bugs.percona.com/

key_buffer_size=268435456
read_buffer_size=16777216
max_used_connections=2
max_threads=2001
thread_count=3
connection_count=0
It is possible that mysqld could use up to
key_buffer_size + (read_buffer_size + sort_buffer_size)*max_threads = 98594314 K  bytes of memory
Hope that's ok; if not, decrease some variables in the equation.

Thread pointer: 0x7f4dd240e000
Attempting backtrace. You can use the following information to find out
where mysqld died. If you see no messages after this, something went
terribly wrong...
stack_bottom = 7f4dd1fbd820 thread_stack 0x40000
/usr/local/mysql/bin/mysqld(my_print_stacktrace+0x2c)[0xed36bc]
/usr/local/mysql/bin/mysqld(handle_fatal_signal+0x461)[0x7a26e1]
/lib64/libpthread.so.0[0x3b17a0f710]
/usr/local/mysql/bin/mysqld(_Z29page_find_rec_max_not_deletedPKh+0xb0)[0xfed130]
/usr/local/mysql/bin/mysqld(_Z22row_search_max_autoincP12dict_index_tPKcPm+0x25f)[0x1057ccf]
/usr/local/mysql/bin/mysqld(_ZN11ha_innobase27innobase_initialize_autoincEv+0xc9)[0xf488e9]
/usr/local/mysql/bin/mysqld(_ZN11ha_innobase4openEPKcij+0xc14)[0xf55894]
/usr/local/mysql/bin/mysqld(_ZN7handler7ha_openEP5TABLEPKcii+0x33)[0x805143]
/usr/local/mysql/bin/mysqld(_Z21open_table_from_shareP3THDP11TABLE_SHAREPKcjjjP5TABLEb+0x766)[0xd4c966]
/usr/local/mysql/bin/mysqld(_Z10open_tableP3THDP10TABLE_LISTP18Open_table_context+0xf91)[0xc529b1]
/usr/local/mysql/bin/mysqld(_Z11open_tablesP3THDPP10TABLE_LISTPjjP19Prelocking_strategy+0x5f2)[0xc59612]
/usr/local/mysql/bin/mysqld(_Z21open_tables_for_queryP3THDP10TABLE_LISTj+0x4b)[0xc59f2b]
/usr/local/mysql/bin/mysqld(_ZN14Sql_cmd_insert12mysql_insertEP3THDP10TABLE_LIST+0x1dd)[0xe1d87d]
/usr/local/mysql/bin/mysqld(_ZN14Sql_cmd_insert7executeEP3THD+0xc2)[0xe1e702]
/usr/local/mysql/bin/mysqld(_Z21mysql_execute_commandP3THDb+0x18d7)[0xcad217]
/usr/local/mysql/bin/mysqld(_Z11mysql_parseP3THDP12Parser_state+0x5d5)[0xcb3385]
/usr/local/mysql/bin/mysqld(_ZN15Query_log_event14do_apply_eventEPK14Relay_log_infoPKcm+0x6a3)[0xe48dc3]
/usr/local/mysql/bin/mysqld(_ZN9Log_event11apply_eventEP14Relay_log_info+0x6e)[0xe474be]
/usr/local/mysql/bin/mysqld(_Z26apply_event_and_update_posPP9Log_eventP3THDP14Relay_log_info+0x1f0)[0xe8c370]
/usr/local/mysql/bin/mysqld(handle_slave_sql+0x15dc)[0xe98aac]
/usr/local/mysql/bin/mysqld(pfs_spawn_thread+0x1b4)[0x123cf24]
/lib64/libpthread.so.0[0x3b17a079d1]
/lib64/libc.so.6(clone+0x6d)[0x3b176e8b6d]

Trying to get some variables.
Some pointers may be invalid and cause the dump to abort.
Query (7f4dd27a8438): is an invalid pointer
Connection ID (thread ID): 9
Status: NOT_KILLED

You may download the Percona Server operations manual by visiting
http://www.percona.com/software/percona-server/. You may find information
in the manual which will help you identify the cause of the crash.
,这个报错的原因比较多,内存不足,磁盘空间不足都可能导致。先看了下内存使用情况。100G+的内存只剩不到1G,先释放出了15G+内存,重启,依然报错。
![]() ,磁盘空间也很充裕,进一步怀疑是不是master上下放的特殊的SQL导致的,根据日志:
,磁盘空间也很充裕,进一步怀疑是不是master上下放的特殊的SQL导致的,根据日志:
[Note] Slave SQL thread for channel '' initialized, starting replication in log 'mysql-bin.000549' at position 6759798, relay log去master上把停止位置的binlog解析
mysqlbinlog --no-defaults -v -v -v --start-position=6759798 mysql-bin.000549 > .mysql-bin.000549.binlog
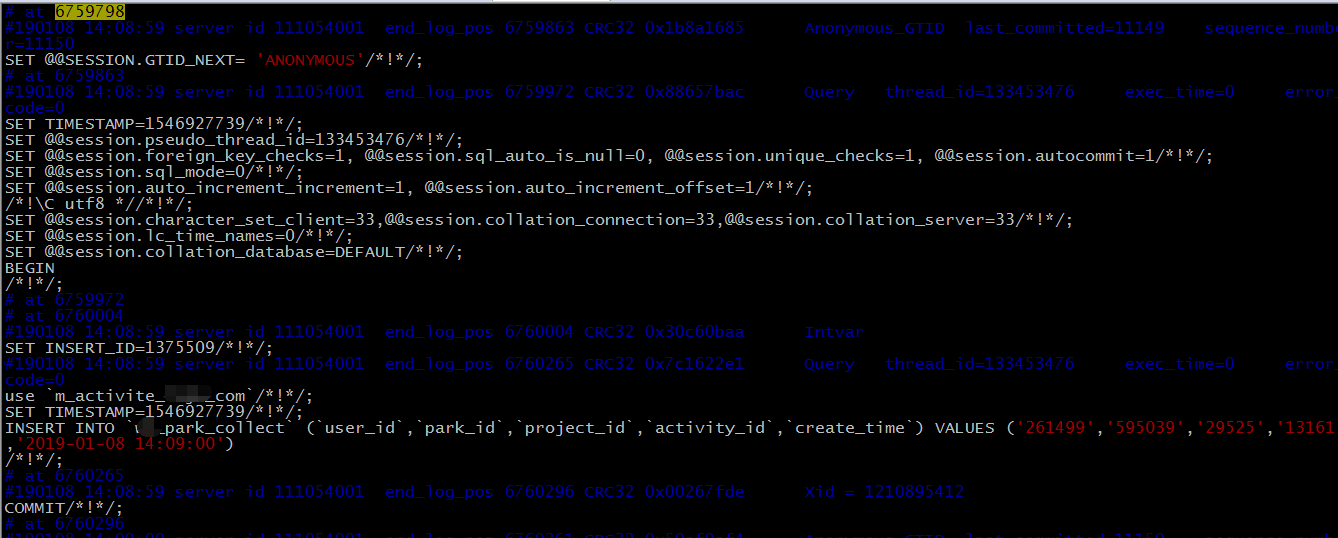
,这条sql看起来很正常啊,后来多次重启发现一个规律。start实例没问题,不会崩溃,但是只要一start slave,就崩溃。开始猜测是不是和这个表=本身存在什么关系,比如,表损坏。在master上check了下表,状态正常。但是在当前slave上,没法check,也没法use 库,也没法select(或其他DML)当前表的数据,只要一操作就崩溃
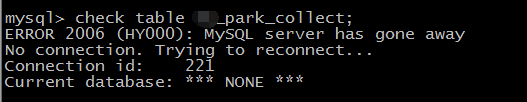
,但是操作其他表没有问题,查看引擎状态,没有异常。虽然怀疑是次表的问题,但是没证据印证。本着先恢复服务(虽然此实例还没交付生产)的态度,去昨天天源slave上重新copy一份数据恢复一个先实例试试。结果,结果

复制倒当前表直接报了IO异常,磁盘问题无疑了。跑了下脚本看了下,确定坏了一块硬盘
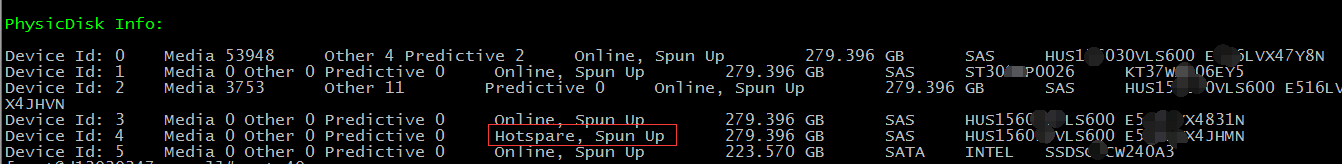
,直接找相关运维更换硬盘,问题解决(期待是这样,哈哈)。


 836
836

 被折叠的 条评论
为什么被折叠?
被折叠的 条评论
为什么被折叠?
 到【灌水乐园】发言


