


 本文分享了如何快速查看代码执行时间、函数调用次数、解决视图缩放锯齿化问题、以及在Instrument中高效使用时间分析工具的方法。同时介绍了如何在IDE中快速添加异常、符号和单独断点,简化调试流程。

1.如何快速的查看一段代码的执行时间。
#define TICK   NSDate *startTime = [NSDate date]
#define TOCK   NSLog(@"Time: %f", -[startTime timeIntervalSinceNow])
在想要查看执行时间的代码的地方进行这么处理
TICK
//do your work here
TOCK
2.如何快速查看一个函数的调用次数,且不添加一句代码。 如下图
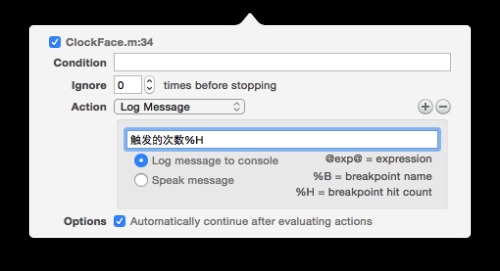
look Hitcount
这种方法适合于一个if方法,一个for循环,而且不会中断程序,切不需要加一句代码。但是一定要记得选中下面的automatically continue after evaluting actions;
3.在使用view的缩放的时候,layer.border.width随着view的放大,会出现锯齿化的问题,解决这个问题需要设置这个属性。
self.layer.allowsEdgeAntialiasing = YES;
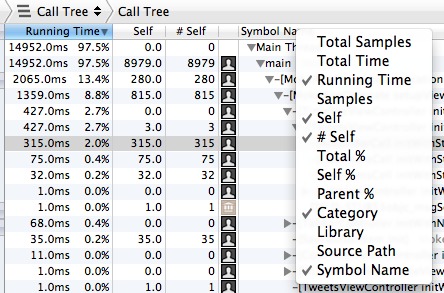
4.instrument中time profile 中的self, #self,%self各代表什么 ?
self
下面引用了一下网上的具体内容
Self is "The number of times the symbol calls itself." according to the Apple Docs on the Time Profiler.
From the way the numbers look though, it seems self is the summed duration of samples that had this symbol at the bottom of its stack trace. That would make:
self: the number of samples where this symbol was at the bottom of the stack trace
% self: the percent of self samples relative to total samples of currently displayed call tree
(eg - #self / total samples).
So this wouldn't tell you how many times a method was called. But it would give you an idea how much time is spent in a method or lower in the call tree.
6.如何快速添加一个全局异常断点,(一步顶三步)。和添加一个symbloic断点,(一步还是顶三步)添加一个断点不使用鼠标
add breakPoint
看到图了吧,加这些断点完全不需要动一下鼠标(恕我吹牛B了),加单独断点的时候动了下鼠标,但那是我故意让你们看到我是有鼠标的。
首先
All Exception断点是我们很常用的,这个我是这样用一个快捷键做到的!通过改键command +p为加异常断点的,要说怎么改,翻我以前博客去!然后加symbloic的快捷键为
commnamd + option + \加一个单独一行断点的快捷键为
command + \
好吧,就说这些吧,最近准备把xVim搞熟练,什么鼠标,触摸板统统都走开!


 5392
5392

 被折叠的 条评论
为什么被折叠?
被折叠的 条评论
为什么被折叠?
 到【灌水乐园】发言


