


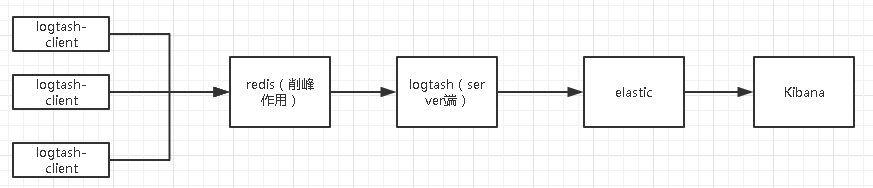
记录一下自己的搭建经历,先看一下图片记录下整理结构
这里主要讲述elk套件的配置,其它前置环境的安装请自行百度或者脑补,
前置条件:JKD1.8(注意必须1.8或者以上),Redis(单点或者Cluster)
1.下载安装elasticsearch
wget https://artifacts.elastic.co/downloads/elasticsearch/elasticsearch-5.5.0.zip
unzip elasticsearch-5.5.0.zip
cd elasticsearch-5.5.0/
./bin/elasticsearch  #测试使用
正式因为需要后台运行
./bin/elasticsearch -d  或者 nohup ./elasticsearch&
配置 elasticsearch.yml
#这里指定的是集群名称,需要修改为对应的,开启了自发现功能后,ES会按照此集群名称进行集群发现
cluster.name: my-application
node.name: node-1

#目录需要手动创建
path.data: /data/elk/data
path.logs: /data/elk/logs

#ES监听地址任意IP都可访问
network.host: 0.0.0.0
http.port: 9200

#若是集群,可在里面引号中添加,逗号隔开
discovery.zen.ping.unicast.hosts: [“192.168.1.101”]

# enable cors,保证_site类的插件可以访问es
http.cors.enabled: true             #手动添加
http.cors.allow-origin: “*”         #手动添加

# Centos6不支持SecComp,而ES5.2.0默认bootstrap.system_call_filter为true进行检测,所以导致检测失败,失败后直接导致ES不能启动
bootstrap.memory_lock: false        #手动添加
bootstrap.system_call_filter: false     #手动添加
配置jvm参数 conf/jvm.options 默认占用2g内存,因为测试原因我改为了256m
注:ES启动的时候回占用特别大的资源所以需要修改下系统参数,若不修改资源启动会异常退出
sysctl -w vm.max_map_count=262144如果报错:
ERROR: bootstrap checks failed
max file descriptors [4096] for elasticsearch process likely too low, increase to at least [65536]
修改资源参数
vim /etc/security/limits.conf
*   soft    nofile  65536
*   hard        nofile  131072
*   soft        nproc   65536
*   hard        nproc   131072
//修改后需要注销重新登录或者重启才生效
如果报错:
max number of threads [1024] for user [es] likely too low, increase to at least [2048]
vi /etc/security/limits.d/90-nproc.conf
找到如下内容:
* soft nproc 1024
#修改为
* soft nproc 2048
测试启动成功后,可以先停掉了,直接ctrl+c
注意:不建议使用root用户安装运行,如果需要的话
vi  bin/elasticsearch
#允许root用户启动,修改启动文件,添加下面一行
ES_JAVA_OPTS="-Des.insecure.allow.root=true"
2.安装Logtash (注意:这里要用Redis了,如果和Elastic 不在一起JDK1.8也需要安装)
首先安装Server端,主要任务:从redis读取数据,然后存入Elastic
wget https://artifacts.elastic.co/downloads/logstash/logstash-5.5.1.tar.gz
tar -zxvf logstash-5.5.1.tar.gz
vi 安装目录/etc/logstash.conf  #文件目录和文件自己新建

//logtash 的日志一定要处理 很大...
input {
redis {
host => "127.0.0.1"
port => "6379"
password => "test123!"
key => "logstash-ucenter"
data_type => "list"
type=> "ucenter_warn"
}
}
output {
elasticsearch {
hosts => ["127.0.0.1:9200"]
index => "logstash-%{type}-%{+YYYY.MM.dd}"
document_type => "%{type}"
}
}上面redis地址密码需要根据实际情况修改,elastic密码我修改了,如果没修改可以使用 changeme(默认密码)
然后安装客户端,主要任务:收集应用日志并写入redis
input {
  file {
    path=>"/data/log/tomcat/ucenter_warn.log"
    codec => multiline {
            pattern => "^.*\["
            negate => true
            what => "previous"
    }
  }
}

output {
  redis{
    data_type =>"list"
    key=>"logstash-ucenter"
    host=>"redisIp"
    port=>6379
    password => "test123!"
  }
}
3.安装Kibana
wget https://artifacts.elastic.co/downloads/kibana/kibana-5.5.0-linux-x86_64.tar.gz
tar -zxvf kibana-5.5.0-linux-x86_64.tar.gz
cd kibana-5.5.0-linux-x86_64/
vim config/kibana.yml
# 将默认配置改成如下:
server.port: 5601
server.host: "0.0.0.0"
elasticsearch.url: "http://192.168.2.41:9200"
kibana.index: ".kibana"
4.上面的都安装完成后,剩下的是依次启动(注意:防火墙各个接口请自行打开,redis默认是启动状态)
# 启动 elastic
bin/elasticsearch -d
# 启动logstash server端
nohup bin/logstash -f etc/ >/dev/null&
# 启动logstash client 端
nohup bin/logstash -f etc/ >/dev/null&
#启动 Kibana
nohup bin/kibana >/dev/null&这个是自己回忆写的,可能有漏掉的细节欢迎指出。这个是入门版,接下来有时间的话,会写一篇高可用版本的。
补充:x-pack安装(前提 elasticsearch和kibana安装完成)
x-pack是elasticsearch的一个扩展包,将安全,警告,监视,图形和报告功能捆绑在一个易于安装的软件包中,虽然x-pack被设计为一个无缝的工作,但是你可以轻松的启用或者关闭一些功能
bin/elasticsearch-plugin install x-pack
bin/kibana-plugin install x-pack装了 x-pack 之后访问受到限制,这里默认的用户名:elastic,密码:changeme。可以通过 curl 修改默认密码
curl -XPUT -u elastic 'localhost:9200/_xpack/security/user/elastic/_password' -d '{
"password" : "123456"
}这时候有两个地方需要修改:
logstash server端的配置文件
input {
redis {
host => "127.0.0.1"
port => "6379"
password => "test123!"
key => "logstash-ucenter"
data_type => "list"
type=> "ucenter_warn"
}
}
output {
elasticsearch {
hosts => ["127.0.0.1:9200"]
index => "logstash-%{type}-%{+YYYY.MM.dd}"
document_type => "%{type}"
user => "elastic" //这里需要账号和密码了
password => "test123!"
}
}kibana的配置文件
vim config/kibana.yml

# 将默认配置改成如下:

server.port: 5601
server.host: "0.0.0.0"
elasticsearch.url: "http://192.168.2.41:9200"
kibana.index: ".kibana"
elasticsearch.username: "elastic" //这里的账户密码
elasticsearch.password: "test123!"
# 这里账户密码要和 elastic一致补充kibana关闭小技巧:
fuser -n tcp 5601
kill -9  端口
定时删除指定索引(因为资源占用较多,自己选择)
通过crontab -e定时执行脚本实现,当然也可以自己安装 curator
#!/bin/sh
# delete old index by date s删除两天前的一天
today=`date -d -2days '+%Y.%m.%d'`
echo $today
curl  -u elastic:qq2017!  -XDELETE "http://127.0.0.1:9200/logstash-nginx-"${today} > /tmp/elk_clean.txt

echo "ok"
qq技术交流群:208779755


 被折叠的 条评论
为什么被折叠?
被折叠的 条评论
为什么被折叠?
 到【灌水乐园】发言


