


 本文详细介绍了如何使用DevExpress第三方软件动态生成StepLine图表,包括创建form、拖拽chartControl、初始化图表控件、生成数据表格、创建新系列、绑定数据源、添加Stepline及其文本注释等步骤。
最近在用devexpress 第三方软件做项目。
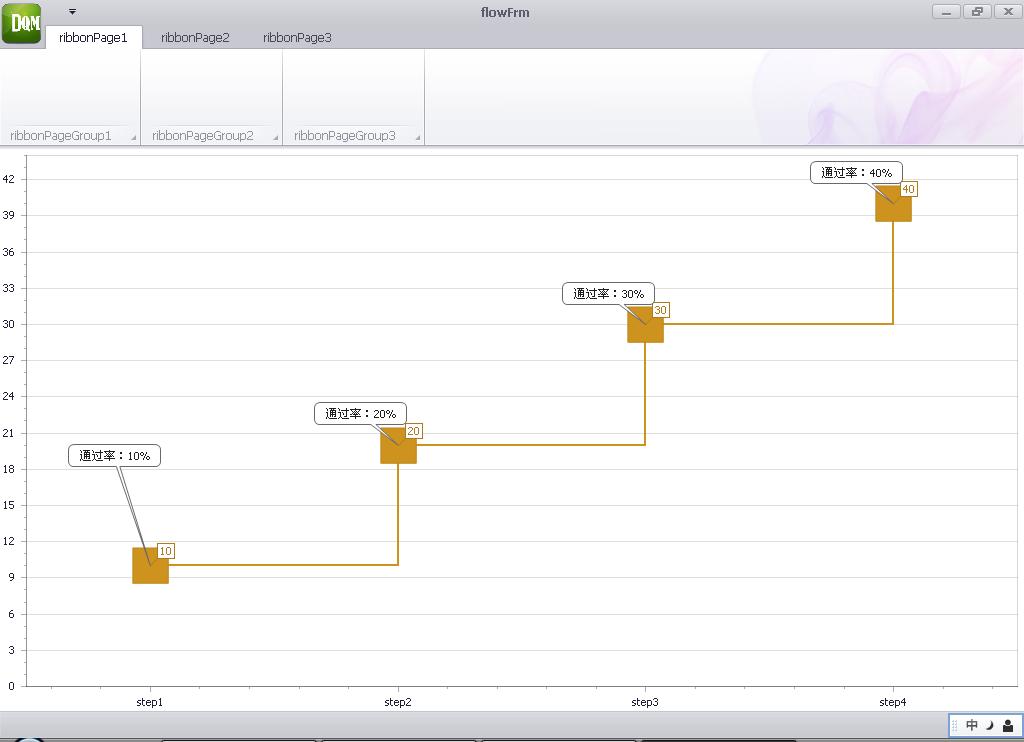
devexpress 的控件使用简单、功能强大、类型丰富、界面优美、扩展性强。今天主要是动态生成了一条StepLine。生成后的效果(能力不强,所以做的比较简单。):
首先,建立一个form(普通的或ribbonform均可),然后拖拽一个chartControl到form中。右键run warzid。然后将预设的线条删除(因为我们要动态添加)。
然后查看form代码。在构造函数中添加方法调用InitCharControl();
然后新建InitCharControl方法,此方法主要功能是生成stepline.
代码如下:

//init ChartControl1

            //create dataTable
            DataTable dt1 = new DataTable();
            dt1.Columns.Add("count", typeof(long));
            dt1.Columns.Add("step", typeof(string));
            dt1.Columns.Add("pass", typeof(string));
            for (int i = 1; i <= 4; i++)
            {
                DataRow dr = dt1.NewRow();
                dr["count"] = i * 10;
                dr["step"] = "step" + i;
                dr["pass"] = "通过率:" + i * 10 + "%";
                dt1.Rows.Add(dr);
            }

            //create new series
            Series series2 = new Series();
            StepLineSeriesView stepLine = new StepLineSeriesView();
            stepLine.LineMarkerOptions.Kind = MarkerKind.Square;
            stepLine.LineMarkerOptions.Size = 50;
            series2.View = stepLine;


            chartControl1.Series.Add(series2);

            //datasource bind
            chartControl1.Series[0].ArgumentDataMember = "step";
            chartControl1.Series[0].ValueDataMembers.AddRange(new string[] { "count" });
            chartControl1.DataSource = dt1;
            int count=0;
            foreach(SeriesPoint point in series2.Points )
            {

                SeriesPointAnchorPoint anchorPoint = new SeriesPointAnchorPoint();
                anchorPoint.SeriesPoint = point;

                TextAnnotation txtAnnotation = new TextAnnotation();
                txtAnnotation.RuntimeRotation = true;
                txtAnnotation.RuntimeResizing = true;
                txtAnnotation.RuntimeMoving = true;
                txtAnnotation.RuntimeAnchoring = true;

                txtAnnotation.Text = dt1.Rows[count++]["pass"].ToString();
                txtAnnotation.ShapePosition = new RelativePosition(319.97, -48);
                txtAnnotation.AnchorPoint = anchorPoint;

                chartControl1.AnnotationRepository.Add(txtAnnotation);
            }
2.添加多条stepline
对于chartControl 只有以条数据显然是没有用的。因此可能会生成多条线,供对比用。
下面我们就来看看如何生成多条setpline(本例以两条为例)
其实从上例中可以看到如何把数据源绑定到一条setpline上,当绑定两条时原理是相同的但是在绑定时就需要将数据源绑定到指定名称或索引值的setpline上。
只需要将绑定语句改写为:
chartControl1.Series[lineName].DataSource = dt1;
以下是完整代码:
     private void InitCharControl(string lineName)
        {
            //init ChartControl1

            #region 手动添加节点、批注

            #endregion
            // get datatable
            DataTable dt1 = InitDataTable();


            //create new series
            Series series2 = new Series(lineName,ViewType.StepLine);
            StepLineSeriesView stepLine = new StepLineSeriesView();
            stepLine.LineMarkerOptions.Kind = MarkerKind.Square;
            stepLine.LineMarkerOptions.Size = 50;
            series2.View = stepLine;

            chartControl1.Series.Add(series2);

            chartControl1.Series[lineName].ArgumentDataMember = "step";
            chartControl1.Series[lineName].ValueDataMembers.AddRange(new string[] { "count" });
            chartControl1.Series[lineName].DataSource = dt1;
            int count = 0;
            foreach (SeriesPoint point in chartControl1.Series[lineName].Points)
            {

                SeriesPointAnchorPoint anchorPoint = new SeriesPointAnchorPoint();
                anchorPoint.SeriesPoint = point;

                TextAnnotation txtAnnotation = new TextAnnotation();
                txtAnnotation.RuntimeRotation = true;
                txtAnnotation.RuntimeResizing = true;
                txtAnnotation.RuntimeMoving = true;
                txtAnnotation.RuntimeAnchoring = true;

                txtAnnotation.Text = dt1.Rows[count++]["pass"].ToString();
                txtAnnotation.ShapePosition = new RelativePosition(319.97, -48);
                txtAnnotation.AnchorPoint = anchorPoint;

                chartControl1.AnnotationRepository.Add(txtAnnotation);
            }
        }
这样只需递归调用该方法并传递不同名字,就会生成不同的stepline啦,生成的线系统会自动用不同颜色进行区别,当然你也可以自己改造该函数在构造线时指定颜色,如果有隐藏数据需要绑定到节点上可以利用节点的tag属性进行绑定。


 913
913

 被折叠的 条评论
为什么被折叠?
被折叠的 条评论
为什么被折叠?
 到【灌水乐园】发言


