


 本文详细介绍了Bootchart工具在Android设备上的安装、配置及使用方法,包括初始化、数据收集、生成图形化报告等步骤,并提供了故障排查技巧,帮助开发者深入理解Android启动过程。

Bootchart is a system designed to show a graphical display of the activity of a system during boot.
。。。
省略官方简介,下面是相关连接:
http://www.elinux.org/Using_Bootchart_on_Android;
1、Installing the bootchart tool 安装工具
sudo apt-get install bootchart2、Building 'init' with bootchart support 重新编译init
可以重新编译整个工程
$ cd mydroid
$ export INIT_BOOTCHART=true
$ make clean
$ make
或者是单独编译init模块
 $ touch system/core/init/init.c
 $ m INIT_BOOTCHART=true
3、Installing 'init' into your system image 重新加载init模块
重新刷机或者adb push 到android机台,注意更改权限;
adb push out/target/product/generic/root/init /init4、Triggering bootchart functionality on system boot 使能bootchart 工具
adb shell 'echo 120 > /data/bootchart-start'5、Retrieving the collected data from the system 获取数据
在/data/bootchart文件下bootchart 生成的数据
可以使用bootchart 自带的脚本grab-bootchart.sh进行拷贝和打包;也可以自行进行adb pull到ubuntu机器中进行打包;
6、Generating the graphic from the data 生成png图片
$bootchart ./bootchart.tgz执行该命令后,直接生成错误提示:
    parsing 'header'
    parsing 'proc_stat.log'
    parsing 'proc_ps.log'
    warning: no parent for pid '2' with ppid '0'
    parsing 'proc_diskstats.log'
    parsing 'kernel_pacct'
    merged 0 logger processes
    pruned 63 process, 0 exploders, 2 threads, and 0 runs
    False
    Traceback (most recent call last):
      File "/usr/bin/bootchart", line 23, in <module>
        sys.exit(main())
      File "/usr/lib/pymodules/python2.6/pybootchartgui/main.py", line
    137, in main
        render()
      File "/usr/lib/pymodules/python2.6/pybootchartgui/main.py", line
    128, in render
        batch.render(writer, res, options, filename)
      File "/usr/lib/pymodules/python2.6/pybootchartgui/batch.py", line
    41, in render
        draw.render(ctx, options, *res)
      File "/usr/lib/pymodules/python2.6/pybootchartgui/draw.py", line
    282, in render
        draw_chart(ctx, IO_COLOR, True, chart_rect, [(sample.time,
    sample.util) for sample in disk_stats], proc_tree)
      File "/usr/lib/pymodules/python2.6/pybootchartgui/draw.py", line
    201, in draw_chart
        yscale = float(chart_bounds[3]) / max(y for (x,y) in data)
    ZeroDivisionError: float division
该错误是由python版本导致,进行以下修改可以解决该问题:修改下/usr/share/pyshared/pybootchartgui/目录的draw.py,parsing.py,samples.py三个文件:
draw.py
    将200,201行由:
    xscale = float(chart_bounds[2]) / max(x for (x,y) in data)
    yscale = float(chart_bounds[3]) / max(y for (x,y) in data)
    改为:
    xscale = float(chart_bounds[2]) / max(0.00001, max(x for (x,y) in data))
    yscale = float(chart_bounds[3]) / max(0.00001, max(y for (x,y) in data))
parsing.py
在156行后添加:
    if interval == 0:
        interval = 1
修改后如下:
    sums = [ a - b for a, b in zip(sample1.diskdata, sample2.diskdata) ]
    if interval == 0:
        interval = 1
samples.py
在81行后添加:
    if interval == 0:
        interval = 1
修改后如下:
    def calc_load(self, userCpu, sysCpu, interval):
        if interval == 0: <br>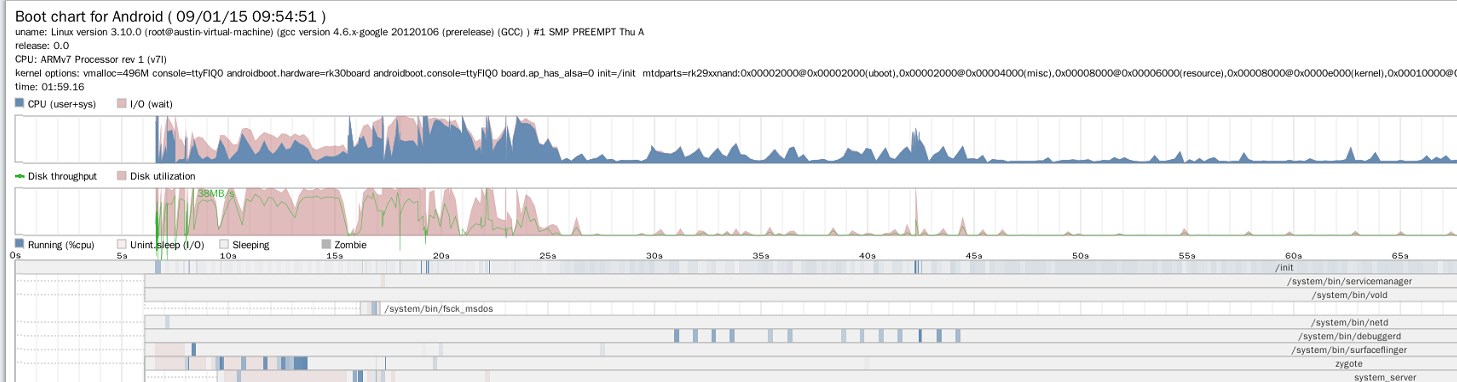
interval = 1再次执行,便可以顺利生成bootchart.png文件
$bootchart ./bootchart.tgz生成的png文件如下所示:

参考文章:
http://blog.youkuaiyun.com/harry_helei/article/details/8545032


 被折叠的 条评论
为什么被折叠?
被折叠的 条评论
为什么被折叠?
 到【灌水乐园】发言


