


 本文探讨了SQL系统中死锁及阻塞产生的原因,通常源于非优化的查询操作。介绍了使用SQL Profiler进行死锁分析的方法,并展示了如何通过图形化表示理解会话间的锁竞争。此外,还讨论了通过设置优先级来控制死锁解决策略。
As we already saw, the reasons why we have blocking issues and deadlocks in the system are pretty much the same. They occur because of non-optimized queries. So, not surprisingly, troubleshooting techniques are very similar. Let’s have a quick look. We’ll use the same scripts I used last time.
我们现在已经知道,造成系统阻塞以及死锁的原因往往非常相似,基本都是因为使用了未经过优化的查询造成的。所以排解这些问题的技术非常相似就不那么意外了。让我们仔细来看一看实例,还是用我们以前采用过的脚本。
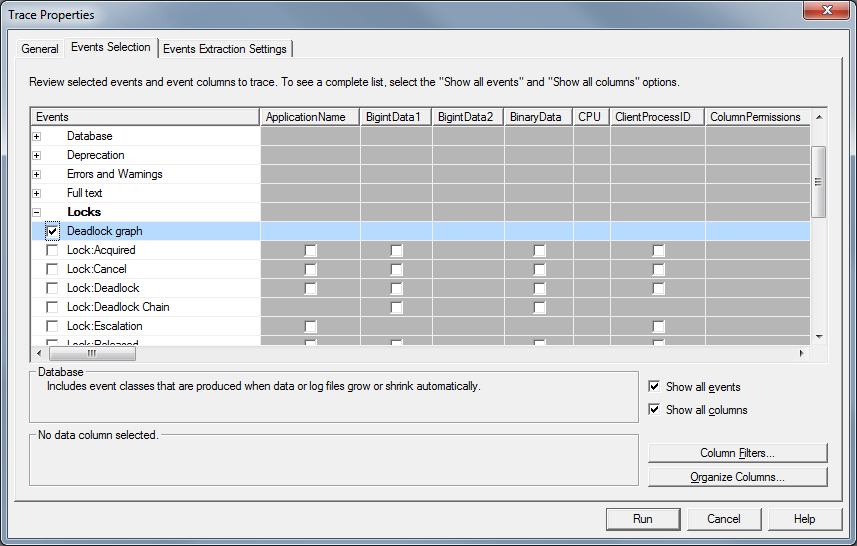
The simplest approach is to use SQL Profiler. There is “Deadlock graph” event in the “Locks” event group you can use. Click on the picture to open it in the different window.
最简单的方法就是采用SQL自带的性能监控工具,这里我们可以使用跟踪属性下面的事件选择项卡,展开锁节点,下面的有一个死锁图可供我们选择,它能帮忙我们分析死锁原因。
Let’s start the trace and trigger deadlock.
现在我们开始跟踪以及触发死锁
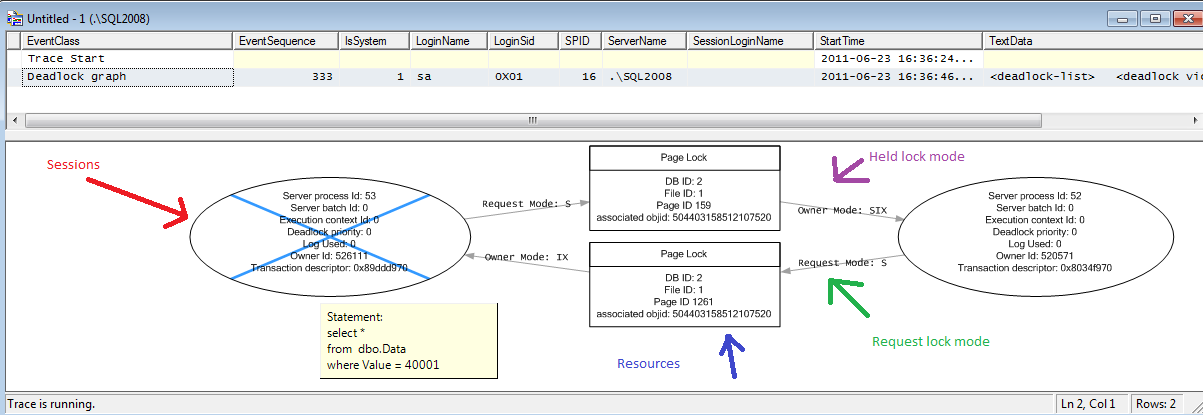
As you can see, it shows you very nice picture. There are 2 sessions (ovals) involved. Those sessions compete for the page locks (squares). You can see what locks each session held and you can even track it down to the resources (but that rarely needed). You can even see the statements when you move the mouse over the session oval and wait for the tool tip.
上面是呈现的是一个非常友好的图,图中包含两个会话(图中椭圆显示)。这两个会话都会竞争数据页(图中方块显示)上的锁。你可以看到每个会话已经获得的锁而且你还可以向下一直跟踪到它们各自所引用的资源(这是非常必要的),甚至你能跟踪到具体的SQL语句块当你将鼠标放在会话的上方时系统会给出相应的提示。
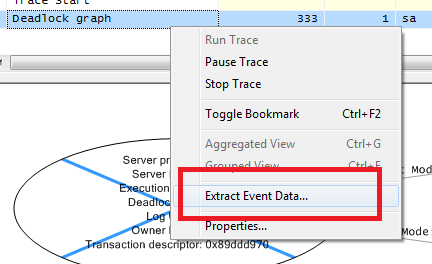
In context menu for “deadlock graph” line in the grid above, you have “Extract event data” menu command that can save this information as the file.
在监视窗口中有一个死锁图的字样,你可以点击右键,此时会弹出属性菜单,你可以将这些死锁相关的信息保存到文件中。
You can open it as the graph in management studio or, technically, simply look at XML which is extremely familiar:
你可以在SQL管理器中打开它,或者直接以XML形式查看也非常眼熟。
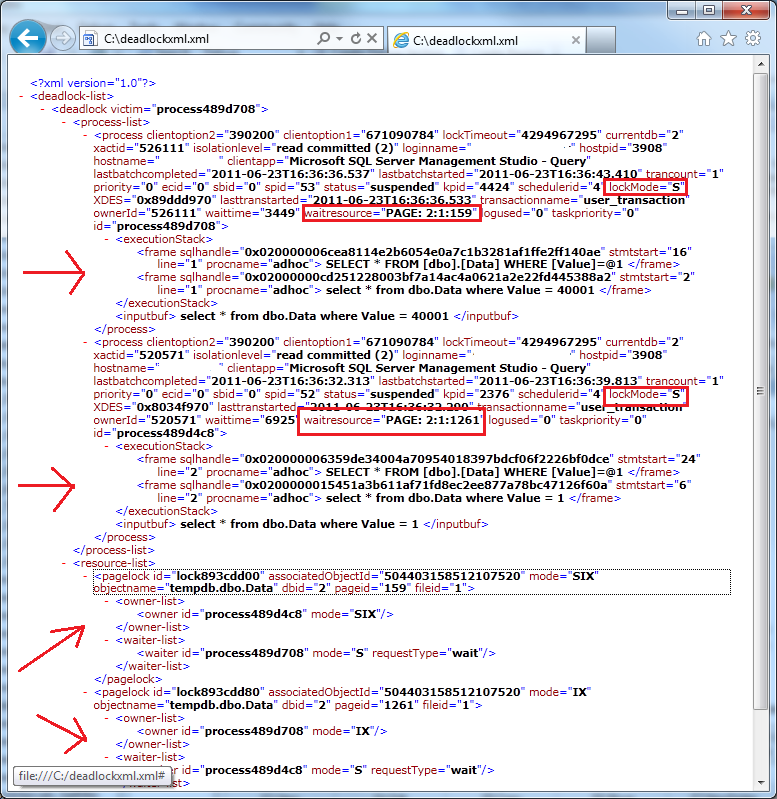
As you can see it’s way more detailed in compare with graphical representation. It’s also extremely familiar with blocking process report – and you can use same technique and query sys.dm_exec_sql_text if you need to obtain sql text from handle. I demonstrated how to do that in post related with blocking troubleshooting.
这是和图形方式非常详细的一个比较说明,它和blocking process report非常相似。你可以同样通过查询sys.dm_exec_sql_text 来显示你需要知道的SQL语句。我之前已经做了一个演示的实例。[翻译]:SQL死锁-阻塞探测
In case, if you don’t want to use SQL Profiler, there are 2 options you can use. The first one is enabling trace flag 1222 with DBCC TRACEON(1222,-1) command. When you have it enabled, SQL Server put deadlock graph XML to SQL Server log.
如果你不想使用SQL自带的性能监测工具,这里还有两种办法。第一就是运行DBCC TRACEON(1222,-1)命令,它将会把死锁相关的信息存储为SQL日志。
Another option is using extended events (SQL Server 2008/2008R2). Again, it’s very powerful method although requires some initial work to set it up. As with the blocking, I’m leaving it out of scope for now.
另外一个方法就是使用在SQL SERVER 2008/2008R2中的扩展事件。它是一个非常强的工具,但需要一些初始化的工作。
How to deal with deadlocks? Of course, the best thing is not to have deadlocks at the first place. Again, golden rule is to optimize the queries. Meanwhile, if you need to control (up to degree) what session will be terminated, you can use SET DEADLOCK PRIORITY option. There are 21 priority levels available. When 2 sessions deadlocked, the session with the lower deadlock priority level would be chosen as the victim. In case of the same priority level (default case), SQL Server chooses the session that is less expensive to rollback.
如何解决死锁?当然,最好的办法就是避免出现死锁,解决死锁的黄金准则就是优化查询。同时,如果你想监控哪一个会话可能会被终止,你可以使用 SET DEADLOCK PRIORITY 这个选项。这里有21种有效的优先级别。当有两个会话出现死锁后,级别低的会话将会成为竞争中的牺牲品。如果两个会话拥有相同的级别,那么SQL会选择一个回滚付出代价比较小的一个做为牺牲品。
If session is chosen as the victim, it would be aborted with error code 1205. In such case client (or T-SQL code) can catch the exception and re-run the query. But again, the best way is avoiding deadlocks at the first place.
如果一个会话被选中为牺牲品,那么它会被取消同时抛出的错误代码为1205。系统客户端可以捕获到这个错误然后重新尝试执行查询。但是最好的方法就是想办法避免出现死锁。


 610
610

 被折叠的 条评论
为什么被折叠?
被折叠的 条评论
为什么被折叠?
 到【灌水乐园】发言


