


六月进入了紧张的996冲刺节奏,一个月下来周围的兄弟们看着都眼神迷离,面色阴沉,着实疲惫。幸运的是最后一个周末通知大家不用继续加班,我也好腾出手来写点东西,长时间停更让人脑袋空空,思来想去决定探索一个之前听说过觉得好玩,但是又没有实践过的东西-火焰图。
何为火焰图
通过一个Demo认识火焰图
本地写一段简单的代码来看看生成的火焰图长什么样子,代码如下:

import java.io.IOException;
import java.util.concurrent.TimeUnit;

/**
 * func_c
 * func_b
 * func_a
 * start_thread
 *
 * func_d
 * func_a
 * start_thread
 *
 * func_d
 * func_a
 * start_thread
 */
public class ThreadProfileTest {

    // 模拟 func_a 方法
    public static void func_a(int i) throws InterruptedException {
        System.out.println("Executing func_a");

        if (i <=1 ) {
            func_d();
        } else {
            func_b();
        }
    }

    // 模拟 func_b 方法
    public static void func_b() throws InterruptedException {
        System.out.println("Executing func_b");
        func_c();
    }

    // 模拟 func_c 方法
    public static void func_c() throws InterruptedException {
        long start = System.currentTimeMillis();
        while(true){
            System.out.println("Executing func_c");
            Thread.sleep(10);
            if(System.currentTimeMillis()  - start > TimeUnit.MINUTES.toMillis(1)){
                break;
            }
        }

    }

    // 模拟 func_d 方法
    public static void func_d() throws InterruptedException {
        long start = System.currentTimeMillis();
        while(true){
            System.out.println("Executing func_d");
            Thread.sleep(10);
            if(System.currentTimeMillis()  - start > TimeUnit.MINUTES.toMillis(1)){
                break;
            }
        }

    }

    // 启动新线程来执行 func_a
    public static void start_thread(int i) {
        System.out.println("Starting new thread...");

        Thread thread = new Thread(() -> {
            try {
                func_a(i);
            } catch (InterruptedException e) {
                throw new RuntimeException(e);
            }
        });

        thread.start();
    }

    public static void main(String[] args) throws InterruptedException, IOException {
        //为命令行生成火焰图预留时间
        Thread.sleep(20000);

        // 主线程启动多个线程来模拟不同的调用路径
        for (int i = 0; i < 3; i++) {
            start_thread(i);
            Thread.sleep(100);
        }
        System.in.read();
    }
}

java可以使用async-profiler工具采集cpu的使用情况,看看这个demo最终形成的cpu火焰图长什么样子
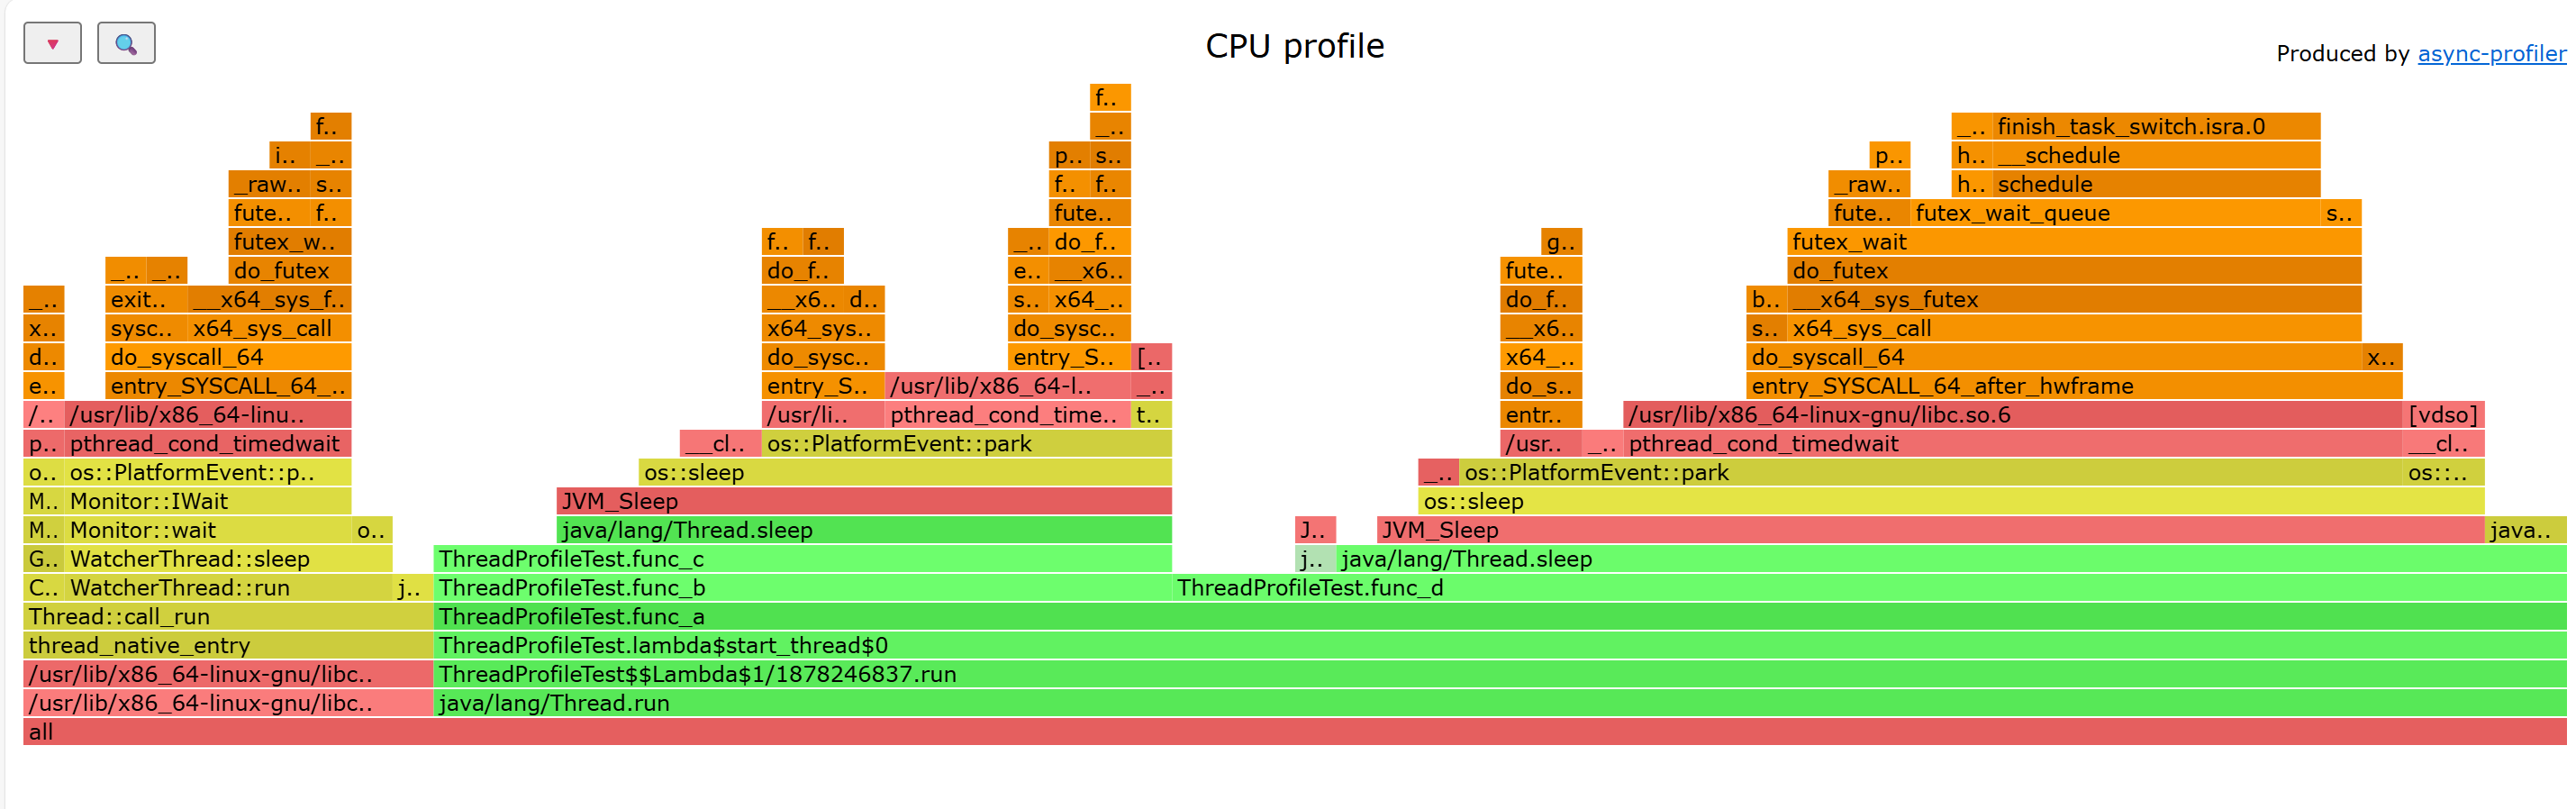
基本结构与颜色含义
关键调用链与耗时热点
性能分析方向
不难发现fun_c和func_d占用了较多的cpu时间,可能存在性能问题,需要结合代码去做优化。
应该关注火焰图的哪些方面
Flame graphs can be interpreted as follows:
• The top edge of the flame graph shows the function that was running on the CPU when the stack trace was collected. For CPU profiles, this is the function that is directly consuming CPU cycles. For other profile types, this is the function that directly led to the instrumented event.
• Look for large plateaus along the top edge, as these show a single stack trace was frequently present in the profile. For CPU profiles, this means a single function was frequently running on-CPU.
• Reading top down shows ancestry. A function was called by its parent, which is shown directly below it; the parent was called by its parent shown below it, and so on. A quick scan downward from a function identifies why it was called.
• Reading bottom up shows code flow and the bigger picture. A function calls any child functions shown above it, which, in turn, call functions shown above them. Reading bottom up also shows the big picture of code flow before various forks split execution into smaller towers.
• The width of function boxes can be directly compared: wider boxes mean a greater presence in the profile and are the most important to understand first.
• For CPU profiles that employ timed sampling of stack traces, if a function box is wider than another, this may be because it consumes more CPU per function call or that the function was simply called more often. The function-call count is not shown or known via sampling.
• Major forks in the flame graph, spotted as two or more large towers atop a single function, can be useful to study. They can indicate a logical grouping of code, where a function processes work in stages, each with its own function. It can also be caused by a conditional statement, which chooses which function to call.
大致意思是:
当你手握这把“手术刀”以后,是不是迫不及待想对自己眼前的代码来个庖丁解牛,那我就再把自己练手的准备工作跟大家伙啰嗦一下,希望能少走弯路。
选一个趁手的工具
如果你要分析运行在linux服务器上的java程序时,我推荐直接使用arthas工具(基于async-profile),但是我相信有不少同学可能和我一样想在自己的windows pc机上写一点简单的Demo来帮助自己入门,目前async-profile还不支持windows,紧接着我就搜索各种在windows上生成火焰图的方法,也跟着下了不少的工具,但是和async-profile呈现的效果还是有不少区别,最终决定基于windows的WSL来模拟linux环境快速验证。
WSL是适用于 Linux 的 Windows 子系统(WSL)是 Windows 的一项功能,可用于在 Windows 计算机上运行 Linux 环境,而无需单独的虚拟机或双重启动。 WSL 旨在为想要同时使用 Windows 和 Linux 的开发人员提供无缝高效的体验。
在使用WSL之前差不多浪费了几个小时找各种工具,用了WSL也就前后不到半小时,简单描述下步骤,希望看到这里的你少走弯路:
1.根据推荐阅读最后的链接安装WSL,安装完以后WSL中会默认安装Ubuntu
2.在cmd中启动Ubuntu
wsl -d Ubuntu
3.在Ubuntu中安装jdk
apt update
apt install openjdk-11-jdk
4.下载async-profiler&解压缩
wget https://github.com/async-profiler/async-profiler/releases/download/v4.0/async-profiler-4.0-linux-x64.tar.gz
tar -xvf async-profiler-4.0-linux-x64.tar.gz
5.在Ubuntu中编写测试代码(也可以从自己的ide中把编译好的class直接拷贝到Ubuntu运行,我嫌麻烦就直接在Ubuntu写了)
可以基于vim编辑器,然后复制进来。
6.手动编译测试代码
javac ThreadProfileTest.java
这一步估计好多年轻的程序员都没见过,毕竟现在ide太强大了,根本用不到,编译完以后会有一个.class文件。

7.运行编译好的class
|
1
|
java ThreadProfileTest
|
8.找到java进程的pid然后使用async-profile的命令生成火焰图
./asprof -e cpu -d 120 -f /workspace/flamegraph_2029.html 2029
asprof在async-profiler解压缩以后的bin下
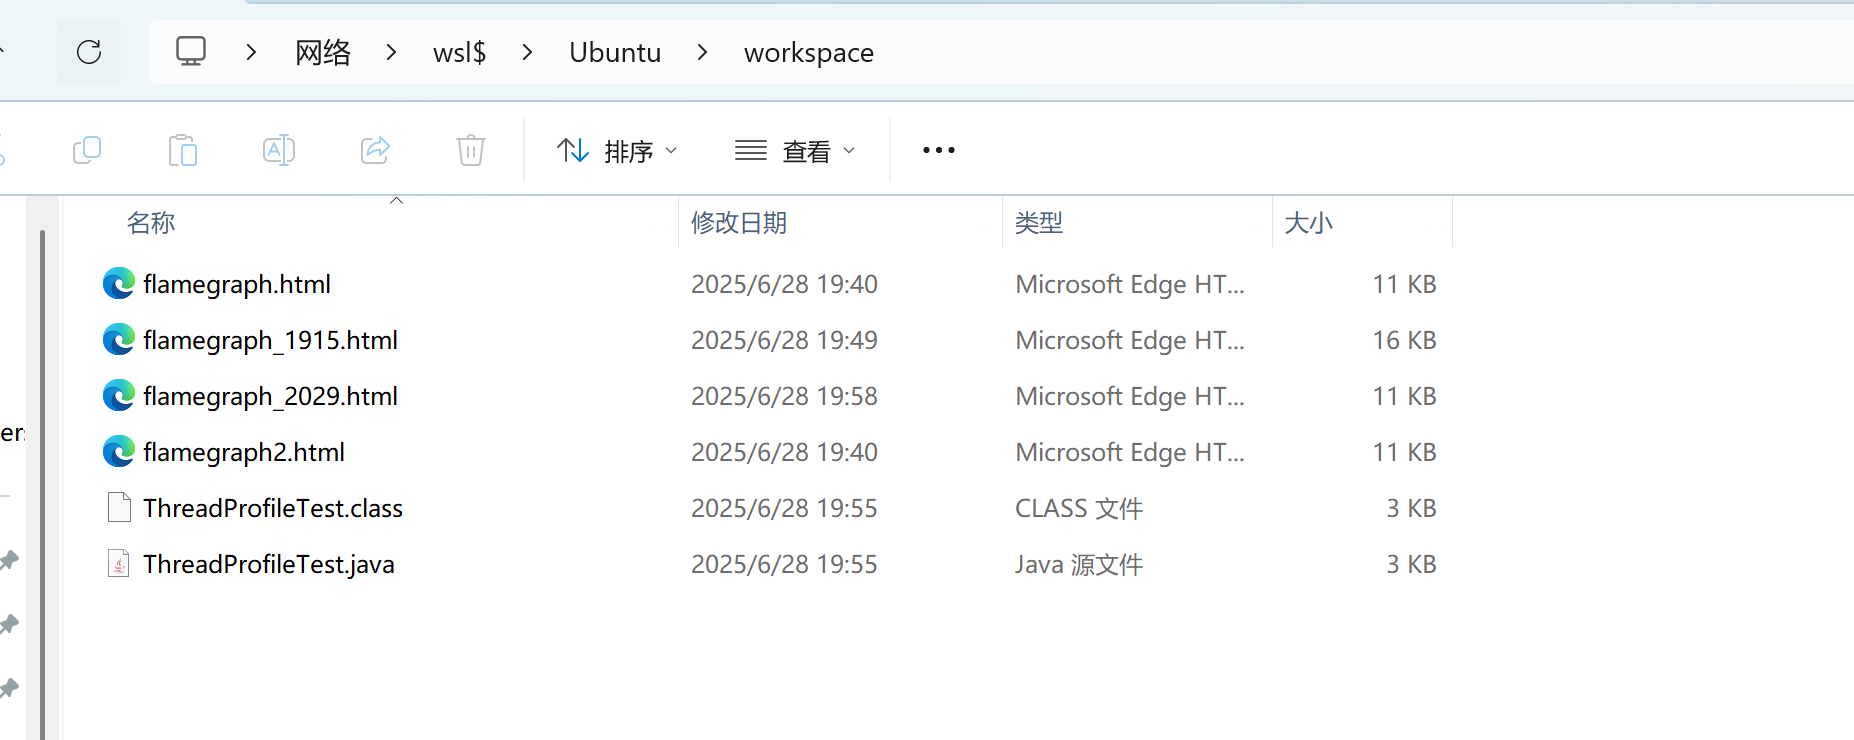
9.我上一步指定了将火焰图放在/workspace目录,所以在自己pc机的文件资源管理器中输入\\wsl$\Ubuntu\workspace然后就可以看到生成的火焰图,直接使用浏览器打开即可
周六没写完,周日大清单爬起来继续写,终于完事,我要出去浪了。
推荐阅读


 650
650

 被折叠的 条评论
为什么被折叠?
被折叠的 条评论
为什么被折叠?
 到【灌水乐园】发言


