Overview
One of the most flexible controls in our library is the grid control. VIBlend DataGrid for Silverlight is the first fully functional OLAP grid for Silverlight. It brings together the features of traditional data grid controls, hierarchical grids and Excel-like pivot tables.VIBlend DataGrid for Silverlight supports both data bindings and complete unbound mode. You can visualize a database table, bind to a generic collectionor populate the grid's content through APIs without using any datasource.
Highlights
Data Binding and Unbound mode
Hierarchies on Rows and on Columns
Sorting
Filtering
Rows Grouping
Pivot tables and OLAP drill-down
Pivot table sorting by Label
Compact and traditional Pivot Rows Rendering
Built-in data aggregation functions
Summaries
Nested Grids
Row Details templates
Tooltips
Rows and Columns resize
Cell styles, Properties and Formatting
Grid Cells Templates
Cell Edit Templates
Cells Merge
Drag & Drop
Rich programming model
OLAP Drill-Through
Office 2007 and Office 2010 Themes
Regional settings support including numbers, currency, dates
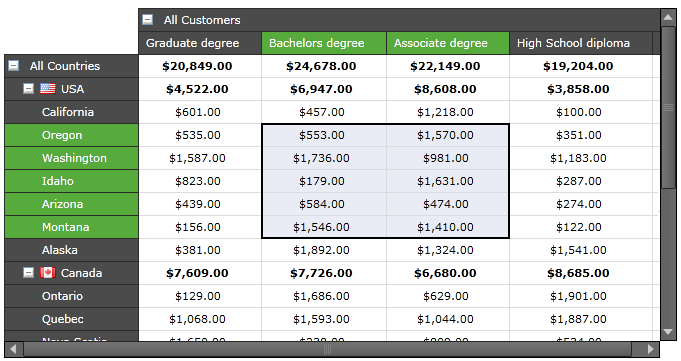
Single and Multiple Cells Selection
Single and Multiple Rows and Columns Selection
Real-Time and Deferred scrolling modes
Grid lines display modes
Keyboard navigation
Export to Excel and XML
Export to HTML and CSV
Examples in C# and VB.NET
Full C# source code available
Data Binding and UnBound mode
VIBlend DataGrid for Silverlight can be bound to a data source or used in unbound mode. It provides a comprehensive set of easy to use APIs that allow you to access and customize almost every little detail.
OLAP Grid - Pivot Table Report
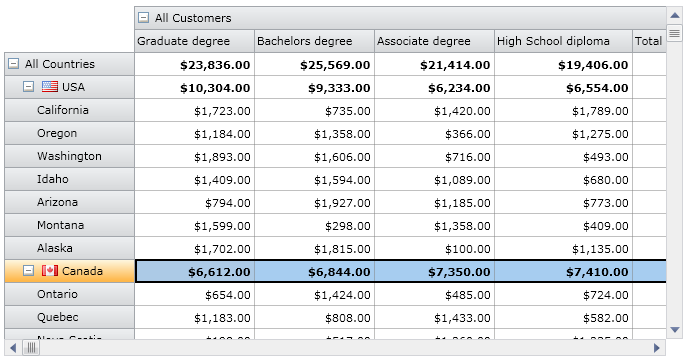
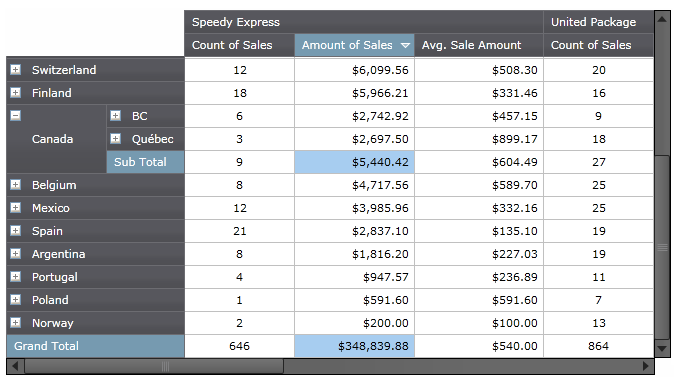
VIBlend DataGrid for Silverlight features a built-in data aggregation engine which is capable of turning any tabular data source into a wide variety of cross tab views. In a typical data grid, the data is flat and consists of many rows and columns. The data may contain multiple cells with the exact same values. In many of these scenarios working with the raw data may not be the best way to spot patterns and analysize trends. The rows grouping feature allows you to group multiple rows by columns where the corresponding grid cells have the same value. Pivot tables go one step further and enable powerful multidimensional data analysis. A Pivot table usually consits of row, column and data (value/fact) fields.
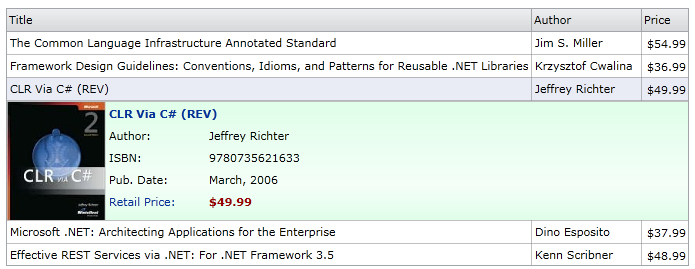
Row Details
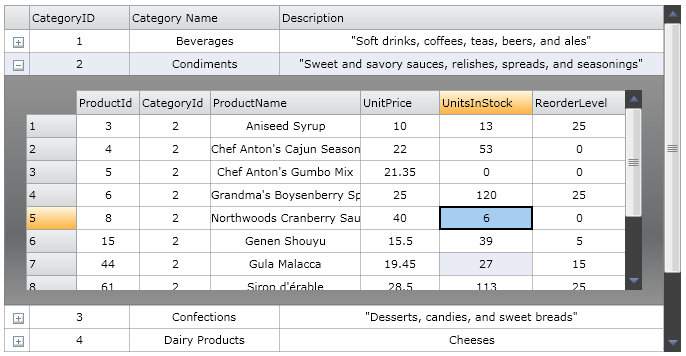
VIBlend DataGrid for Silverlight allow you to specify grid row templates that provide more detailed information. The row details functionality is enabled via standard Silverlight DataTemplates. This allows you to easily display any type of content. The row details area height is configurable for each individual row.
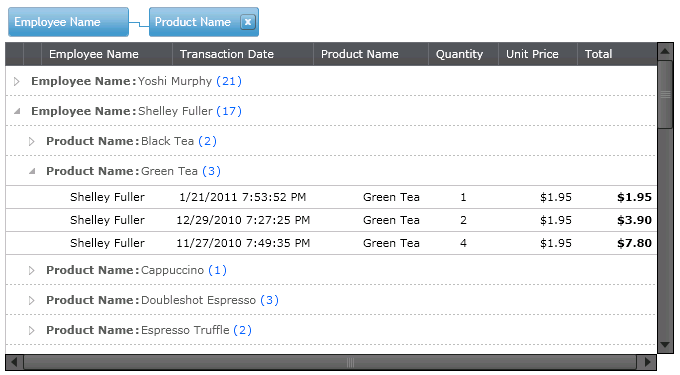
Rows Grouping
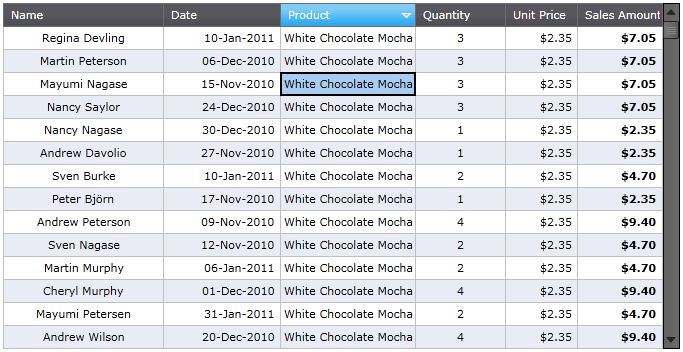
VIBlend DataGrid for Silverlight allows you to group rows by the value of one or more columns. This feature is very useful in many business applications where the data source contains a larger number of rows. For example, you can group Sales records by Product, by Date or any other data column.
Sorting by Rows or Columns
VIBlend DataGrid for Silverlight provides built-in sorting capabilities. The sorting works in both bound and unbound mode. You can sort by columns and by rows. Each column and row has a Sorting property that allows you to enable or disable the sorting functionality. In addition, the data grid control keeps track on the original sort order and you can always see the data in the original (unsorted) order. The sorting algorithm automatically detects if you are sorting numbers, dates, text or other data type, and applies a proper comparison. The sorting APIs are extensible and allow you to plug-in a custom sorting implementation.
Filtering
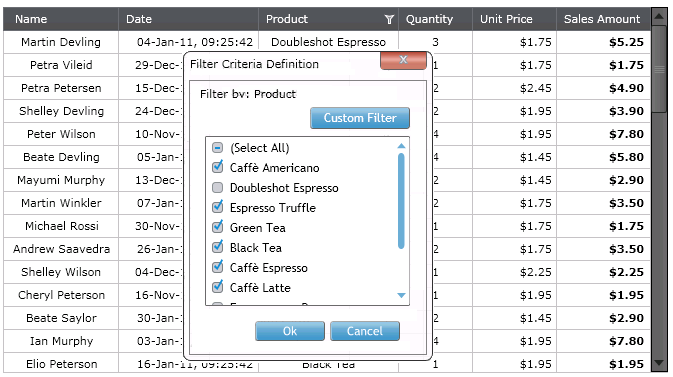
VIBlend DataGrid for Silverlight features an advanced and extensible filtering framework. The filtering functionality works in both bound and unbound mode and you can filter by any column or row. VIBlend DataGrid provides built-in filters, and filter expression definition UI for the most common numerical, date/time and text data types. Extensible APIs allow you to build custom filters and filtering expressions for any data type.
Cells Formatting
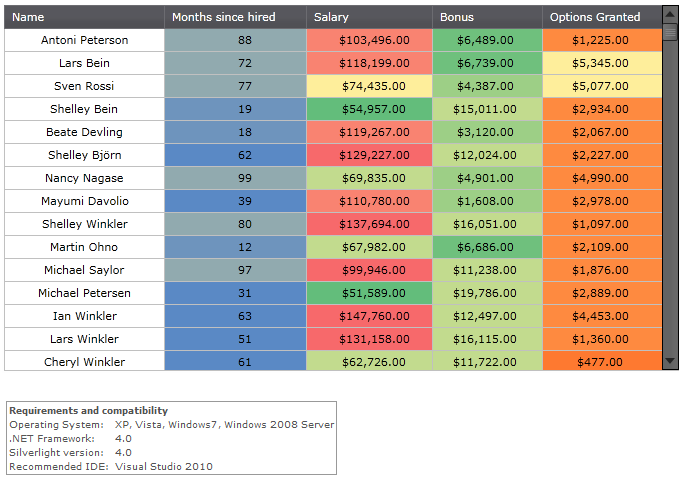
VIBlend Silverlight DataGrid allows you to use standard .NET format strings to format the grid cells content. In addition, you can completely replace the default cell template with a custom template. You can also create a custom cell style and easily replace the built-in style. Our DataGrid's cells are true Silverlight content controls, so they can contain anything.
Cell Images
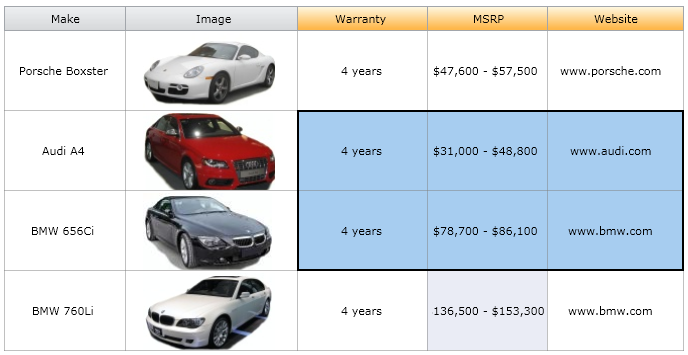
You can create great looking interfaces with cell images, editable fields, animations and themes. The data grid cells are completely customizable. You can easily change Styles and DataTemplates for entire rows, columns or individual grid cells.
Nested Data Grids
VIBlend DataGrid for Silverlight allows you to display hierarchical data using nested data grids. You can add a nested grid or any other control within the row details area of the parent grid. There are no restrictions on the levels of nesting.
Sub Totals and Grand Totals
In Pivot mode, VIBlend DataGrid for Silverlight allows you to display automatic sub totals and grand totals. You can enable sub totals and grand totals independently for rows and columns.
Themes and Styling
VIBlend DataGrid for Silverlight ships with a nice set of professionally designed themes. This will help you deliver consistent look and feel in your applications. The flexible infrastructure allows you to create your own themes and change the styles and colors of almost any visual element. For example, you can build a custom cell style, or cell data template and use it with any grid cell.


 VIBlendDataGrid for Silverlight是一款高度灵活的数据网格控件,支持数据绑定及未绑定模式,具备强大的OLAP及透视表功能,提供丰富的自定义选项,包括行列分组、数据筛选、单元格样式等。


 5万+
5万+

 被折叠的 条评论
为什么被折叠?


