


 本文介绍了使用HTML和JavaScript绘制柱状图、线图的方法,包括利用table元素、VML及JFreechart等技术实现漂亮的图表展示,并展示了如何结合数据库生成动态图表。
原文:http://www.blogjava.net/JAVA-HE/archive/2007/05/08/115813.html
一、 利用基本的TABLE元素
——自己的创意之作
可以参考我先前的一篇关于TABLE制作柱状图的blog:
http://www.blogjava.net/JAVA-HE/archive/2007/04/20/112352.html
如果只是需要在页面上现实一些柱状图,那么这种方式是非常简单和实用的。核心原理利用HTML的基本元素——table。绘制table,不显示其边框,不显示其间距,然后利用获得的数据,使用JS控制哪行哪列用什么颜色。
如:
document.getElementById('tab').rows[0].cells[0].bgColor = 'red';
二、立体感的柱状图
——这是在网上陶下来的漂亮代码
 <html xmlns:v="urn:schemas-microsoft-com:vml" xmlns:o="urn:schemas-microsoft-com:office:office">
2
3
<!--[if !mso]>
4
5
<style>
6
7
v\:* { behavior: url(#default#VML) }
8
9
o\:* { behavior: url(#default#VML) }
10
11
.shape { behavior: url(#default#VML) }
12
13
</style>
14
15
<![endif]-->
16
17
<HEAD>
18
19
<TITLE>柱状图形报表样列</TITLE>
20
21

 <SCRIPT LANGUAGE="JavaScript">

22

23
//addPole 增加一个柱状图
24
25
//left 与窗口左边的距离
26
27
//width 宽度
28
29
//height 高度
30
31
//zindex 层高度
32
33
//fillcolor 主色
34
35
//color 渐变色
36
37
//type 默认为竖,1为横
38
39

 function addPole(left,top,width,height,zindex,fillcolor,color,type)
{
function addPole(left,top,width,height,zindex,fillcolor,color,type)
{
40
41
top=top-height;
42
43
var a="";
44
45
if(type==1)
{
46
47
a="angle='-90' focus='100%'";
48
49
 }
}
50
51
var html="<v:rect style='position:absolute;";
52
53
html=html+"left:"+left+"px;";
54
55
html=html+"top:"+top+"px;";
56
57
html=html+"width:"+width+"px;";
58
59
html=html+"height:"+height+"px;";
60
61
html=html+"z-index:"+zindex+"'";
62
63
html=html+"fillcolor='"+fillcolor+"'>";
64
65
html=html+"<v:fill color2='"+color+"'";
66
67
html=html+" rotate='t' "+a+" type='gradient'/><o:extrusion v:ext='view' backdepth='20pt' ";
68
69
html=html+"color='"+fillcolor+"' on='t'/></v:rect>";
70
71
document.write(html);
72
73
}
74
75
76
77
//left 与窗口左边的距离
78
79
//width 宽度
80
81
//height 高度
82
83
//zindex 立体高度
84
85
//fillcolor 主色
86
87
function addBackground(left,top,width,height,zindex,fillcolor)
{
88
89
top=top-height;
90
91
var html="<v:rect style='position:absolute;left:"+left+"px;";
92
93
html=html+"top:"+top+"px;";
94
95
html=html+"width:"+width+"px;";
96
97
html=html+"height:"+height+"px;";
98
99
html=html+"z-index:"+zindex+"'";
100
101
html=html+"fillcolor='"+fillcolor+"'";
102
103
html=html+" stroked='f'><v:fill rotate='t' angle='-45' focus='100%' type='gradient'/></v:rect>";
104
105
document.write(html);
106
107
}
108
109
110
111
function addLine(zindex,from,to,color)
{
112
113
var html="<v:line style='position:absolute;left:0;text-align:left;top:0;flip:y;z-index:"+zindex+"'";
114
115
html=html+" from='"+from+"' to='"+to+"' strokecolor='"+color+"'/>"
116
117
document.write(html);
118
119
}
120
121
122
123
function addText(left,top,width,height,zindex,value,fontsize)
{
124
125
top=top-height;
126
127
var html="<v:shape style='position:absolute;left:"+left+"px;";
128
129
html=html+"top:"+top+"px;";
130
131
html=html+"width:"+width+"px;";
132
133
html=html+"height:"+height+"px;";
134
135
html=html+"z-index:"+zindex+"'>";
136
137
html=html+"<v:textbox inset='0px,0px,0px,0px'><table cellspacing='3' cellpadding='0' width='100%' height='100%'><tr><td";
138
139
html=html+" style='FONT-SIZE:"+fontsize+"' align='center'>"+value+"</td></tr></table></v:textbox></v:shape>";
140
141
document.write(html);
142
143
}
144
145
146
147
function addGround(left,top,width,height,zindex,fillcolor,linecolor1,linecolor2,offset,level,min,leftoffset,textwidth,textheight,fontsize)
{
148
149
addBackground(left,top,width,height,zindex,fillcolor);
150
151
addLine(zindex,left+"px,"+top+"px",((left-0)+(width-0))+"px,"+top+"px",linecolor1);
152
153
addLine(zindex,left+"px,"+top+"px",left+"px,"+(top-height)+"px",linecolor1);
154
155
addLine(zindex,((left-0)+(offset-0))+"px,"+(top-offset)+"px",((left-0)+(width-0))+"px,"+(top-offset)+"px",linecolor2);
156
157
addLine(zindex,((left-0)+(offset-0))+"px,"+(top-offset)+"px",((left-0)+(offset-0))+"px,"+(top-height)+"px",linecolor2);
158
159
addLine(zindex,left+"px,"+(top-offset)+"px",((left-0)+(offset-0))+"px,"+top+"px",linecolor2);
160
161
for(var i=1;i<level;i++)
{
162
163
addLine(zindex,left+"px,"+(top-offset-(height*i)/level)+"px",((left-0)+(offset-0))+"px,"+(top-(height*i)/level)+"px",linecolor2);
164
165
addLine(zindex,(left-leftoffset)+"px,"+(top-(height*i)/level)+"px",left+"px,"+(top-(height*i)/level)+"px",linecolor1);
166
167
addText(left-textwidth,(top-(height*i)/level)+(textheight-0)+2,textwidth,textheight,"-1",i*min,fontsize)
168
169
addLine(zindex,((left-0)+(offset-0))+"px,"+(top-offset-(height*i)/level)+"px",((left-0)+(width-0))+"px,"+(top-offset-(height*i)/level)+"px",linecolor2);
170
171
}
172
173
addLine(zindex,(left-leftoffset)+"px,"+(top-(height*level)/level)+"px",left+"px,"+(top-(height*level)/level)+"px",linecolor1);
174
175
addText(left-textwidth,(top-(height*level)/level)+(textheight-0)+2,textwidth,textheight,"-1",level*min,fontsize)
176
177
}
178
179
180
181
function addEPole(left,top,width,height,zindex,fillcolor,color,textwidth,textheight,value1,value2,fontsize)
{
182
183
addText(left-textwidth/2+width/2,top-height-10,textwidth,textheight,zindex,value1,fontsize);
184
185
addText(left-textwidth/2+width/2,(top-0)+(textheight-0),textwidth,textheight,zindex,value2,fontsize);
186
187
addPole(left,top,width,height,zindex,fillcolor,color)
188
189
}
190

191
</SCRIPT>
192
193
</HEAD>
194
195
196
197
<BODY>
198
199
<div>
200
201
<SCRIPT LANGUAGE="JavaScript">
202
203
<!--
204
205
206
207
addEPole("180","400","30","150","1","#3300FF","#66FFFF","80","18","300","1月份","9pt");
208
209
addEPole("230","400","30","300","1","#FF0000","#99FFFF","80","18","600","2月份","9pt");
210
211
addEPole("280","400","30","200","1","#33CC00","#99FFFF","80","18","400","3月份","9pt");
212
213
addEPole("330","400","30","100","1","#FF0099","#99FFFF","80","18","200","4月份","9pt");
214
215
addEPole("380","400","30","50","1","#660000","#99FFFF","80","18","100","5月份","9pt");
216
217
addEPole("430","400","30","20","1","#FFFF00","#99FFFF","80","18","40","6月份","9pt");
218
219
addEPole("480","400","30","180","1","#330066","#99FFFF","80","18","360","7月份","9pt");
220
221
addEPole("530","400","30","120","1","#CC6633","#99FFFF","80","18","240","8月份","9pt");
222
223
addEPole("580","400","30","80","1","#9933FF","#99FFFF","80","18","160","9月份","9pt");
224
225
addGround("160","400","460","300","-1","#33CCFF","#000000","#6699CC","10","6","100","20","40","18","9pt")
226
227
//-->
228
229
</SCRIPT>
230
231
</div>
232
233
</body>
234
235
</html>
236
效果图如下:
是不是很漂亮呢?我是觉得很漂亮。
其中方法调用,想知道每个参数的详细信息,你可以自己试:
addEPole("580","400","30","80","1","#9933FF","#99FFFF","80","18","160","9月份","9pt");
参数含义包括上边距离,左边距,以及高宽,以及XY上的内容 。以及颜色,柱体的宽度等等信息。
addGround("160","400","460","300","-1","#33CCFF","#000000","#6699CC","10","6","100","20","40","18","9pt")
定义了范围大小以及6个刻度,每个100,还包括字体大小,刻度线颜色,以及内部线条颜色,以及渐变色等等含义。
三、JFreechart使用
注意生成图都自动存在临时文件夹里的。
总结过上手资料文章:
http://www.blogjava.net/JAVA-HE/archive/2007/04/18/111439.html
但是朋友反映总结得过于粗浅。
这里写详细点:
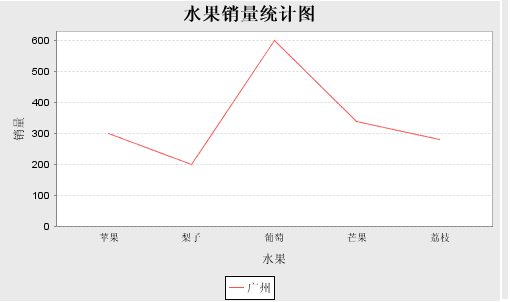
1. 柱状图
DefaultCategoryDataset dataset = new DefaultCategoryDataset ();
2
3
dataset.addValue (300, "广州", "苹果");
4
5
dataset.addValue (200, "广州", "梨子");
6
7
dataset.addValue (600, "广州", "葡萄");
8
9
dataset.addValue (340, "广州", "芒果");
10
11
dataset.addValue (280, "广州", "荔枝");
12
13
JFreeChart chart = ChartFactory.createBarChart3D ("水果销量统计图","水果","销量",
14
15
dataset,PlotOrientation.VERTICAL, //选择水平或者垂直放
16
17
false,//是否显示颜色类别(地区)提示
18
19
false,
20
21
false);
22
23
String filename = ServletUtilities.saveChartAsPNG (chart, 500, 300, null, session);
24
25
String graphURL = request.getContextPath () + "/servlet/DisplayChart?filename=" + filename;
26
27
2. 饼图
DefaultPieDataset data = new DefaultPieDataset();
2
3
data.setValue("六月", 500);
4
5
data.setValue("七月", 580);
6
7
data.setValue("八月", 828);
8
9
PiePlot plot = new PiePlot(data);
10
11
JFreeChart chart = new JFreeChart("", JFreeChart.DEFAULT_TITLE_FONT, plot, true);
12
13
chart.setBackgroundPaint(java.awt.Color.white); //可选,设置图片背景色
14
15
chart.setTitle("Welcome to Jfreechart !"); //可选,设置图片标题
16
17
ChartRenderingInfo info = new ChartRenderingInfo(new StandardEntityCollection());
18
19
//500是图片长度,300是图片高度
20
21
String filename = ServletUtilities.saveChartAsPNG(chart, 500, 300, info, session);
22
23
String graphURL = request.getContextPath() + "/servlet/DisplayChart?filename=" + filename;
24
25
26
27
在插入图片的地方:
28
29
<img src="<%= graphURL %>" width=500 height=300 border=0 usemap="#<%= filename %>">
30
31
32
33
在xml中加入了:
34
35
<servlet>
36
37
<servlet-name>DisplayChart</servlet-name>
38
39
<servlet-class>org.jfree.chart.servlet.DisplayChart</servlet-class>
40
41
</servlet>
42
43
<servlet-mapping>
44
45
<servlet-name>DisplayChart</servlet-name>
46
47
<url-pattern>/servlet/DisplayChart</url-pattern>
48
49
</servlet-mapping>
50
51
图片效果,请访问:http://www.blogjava.net/JAVA-HE/archive/2007/04/18/111439.html
52
53
还可以如下创建 dataset对象:
54
55
double[][] data = new double[][]
{
{672, 766, 223, 540, 126},
{325, 521, 210, 340, 106},
{332, 256, 523, 240, 526} };
56
57
String[] rowKeys =
{"苹果","梨子","葡萄"};
58
59
String[] columnKeys =
{"北京","上海","广州","成都","深圳"};
60
61
CategoryDataset dataset = DatasetUtilities.createCategoryDataset(rowKeys, columnKeys, data);
62
63
效果:

参照网上介绍的一些文章总是发现不能向我的这么顺利,不是说他们的有错。我想版本不一样了 。区别肯定是有的。
实际上建立什么样的图表,ChartFactory可以选择不同方法建立不同图表的。
比如直接讲原来一个柱状图,中改了一个方法,图就变了。
如:
JFreeChart chart = ChartFactory.createLineChart ("水果销量统计图","水果","销量",
2
3
dataset,PlotOrientation.VERTICAL,//选择水平或者垂直放
4
5
true,//广州或者成都,这里颜色有区别的。(颜色类别)
6
7
true,
8
9
true);
10
11
对比两幅图。只是方法名字不同。

再来个3D的:(createLineChart3D方法)

而作为createAreaChart建立的面积比例图:
需要注意点的是,数据先后对图像效果是有影响的。因为有覆盖存在。

补充一个让大家都晕的,我居然一直一位JFreechart 和CEWOLG是一个东西。所以总在那里找标签。还以为我下载的版本不同,所以那些东西都找不到呢!
四、结合cewolf使用
实际上大量应用的是线图:
经典应用,无非是读取数据库,然后根据数据库中的值来生成线图。
生成线图的JSP:
2
3
<%@page pageEncoding="UTF-8"%>
4
5
<%@page import="java.sql.*"%>
6
7
<%@page import="java.util.*"%>
8
9
<%@page import="de.laures.cewolf.*"%>
10
11
<%@page import="de.laures.cewolf.tooltips.*"%>
12
13
<%@page import="de.laures.cewolf.links.*"%>
14
15
<%@page import="org.jfree.data.*"%>
16
17
<%@page import="org.jfree.data.time.*"%>
18
19
<%@page import="org.jfree.data.gantt.*"%>
20
21
<%@page import="org.jfree.chart.*"%>
22
23
<%@page import="org.jfree.chart.plot.*"%>
24
25
<%@page import="org.jfree.data.category.*"%>
26
27
<%@page import="org.jfree.data.general.*"%>
28
29
<%@page import="org.jfree.data.xy.*"%>
30
31
<%@page import="java.awt.*" %>
32
33
<%@page import="de.laures.cewolf.taglib.CewolfChartFactory" %>
34
35
<%@page import="org.jfree.chart.event.ChartProgressListener" %>
36
37
<%@page import="org.jfree.chart.event.ChartProgressEvent" %>
38
39
<%@page import="com.palmtech.util.*" %>
40
41
<%@page import="com.palmtech.sqldata.*" %>
42
43
<%
44
45
final int round=roleInfo.round;//获取游戏轮数
46
47
int[][] loanDataTemp=new int[round][2];
48
49
conn = null;
50
51
result = new Vector ();
52
53
ps = null;
54
55
try
56
57
{
58
59
conn = DriverManager.getConnection ("proxool.BreadServer");
60
61
ps = conn.prepareStatement ("CALL proc_graph_role_fee(?,?,?)");
62
63
ps.setInt (1,gameID);
64
65
ps.setInt (2,roleID);
66
67
ps.setInt (3,2);
68
69
ResultSet rs = ps.executeQuery ();
70
71
for(int histroyRound=0;histroyRound<round;histroyRound++)
72
73
{
74
75
rs.absolute (histroyRound+1);//游标从1开始
76
77
for(int i=0;i<2;i++)
78
79
{
80
81
82
83
loanDataTemp[histroyRound][i]=rs.getInt (2+i);
84
85
//out.print (loanDataTemp[histroyRound][i]+" ");
86
87
}
88
89
//out.println ("<br>");
90
91
}
92
93
rs.close ();
94
95
ps.close ();
96
97
ps = null;
98
99
}
100
101
catch (Exception ex)
102
103
{
104
105
ex.printStackTrace ();
106
107
result = new Vector ();
108
109
}
110
111
finally
112
113
{
114
115
if(ps!=null)
116
117
{try
118
119
{ps.close ();}
120
121
catch(Exception e)
122
123
{}ps=null;}
124
125
try
126
127
{conn.close ();}
128
129
catch(Exception e)
130
131
{}conn=null;
132
133
}
134
135
final int[][] loanData=loanDataTemp;
136
137
%>
138
139
<%
140
141
//if (pageContext.getAttribute("initFlag") == null)
142
143
{
144
145
DatasetProducer g_loan = new DatasetProducer ()
146
147
{
148
149
public Object produceDataset (Map params)
150
151
{
152
153
final String[] seriesNames =
{ "销售利润", "贷款增加额曲线"};
154
155
String[] categories=new String[round];
156
157
for(int i=0;i<round;i++)
158
159
{
160
161
categories[i]=""+(i+1);
162
163
}
164
165
DefaultCategoryDataset dataset = new DefaultCategoryDataset ()
166
167
{
168
169
protected void finalize () throws Throwable
170
171
{
172
173
super.finalize ();
174
175
}
176
177
};
178
179
for (int series = 0; series < seriesNames.length; series ++)
180
181
{
182
183
for (int i = 0; i < categories.length; i++)
184
185
{
186
187
dataset.addValue (loanData[i][series], seriesNames[series], categories[i]);
188
189
}
190
191
}
192
193
return dataset;
194
195
}
196
197
public String getProducerId ()
198
199
{
200
201
return "CategoryDataProducer";
202
203
}
204
205
public boolean hasExpired (Map params, java.util.Date since)
206
207
{
208
209
return (System.currentTimeMillis () - since.getTime ()) > 5000;
210
211
}
212
213
};
214
215
pageContext.setAttribute ("g_loan", g_loan);
216
217
pageContext.setAttribute ("initFlag", "init");
218
219
}
220
221
%>
222
223
<%int r_loan=MathUtil.random(-2, 2);%>
224
225
<html>
226
227
<head>
228
229
<link href="cewolf.css" rel="stylesheet" type="text/css"></head>
230
231
<BODY>
232
233
<p>
234
235
<table border=0>
236
237
<TR>
238
239
<TD>
240
241
<cewolf:chart id="lineChart" title="销售利润/贷款增加额曲线" type="line" xaxislabel="回合数" yaxislabel="金额">
242
243
<cewolf:data>
244
245
<cewolf:producer id="g_loan" />
246
247
</cewolf:data>
248
249
</cewolf:chart>
250
251
<cewolf:img chartid="lineChart" renderer="/cewolf" width="300" height="<%=(r_loan+300)%>"/>
252
253
</TD>
254
255
</TR>
256
257
258
259
</TABLE>
260
261
</body>
262
263
</html>
264
265
266
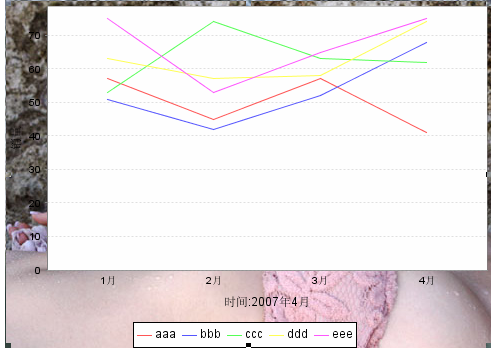
在上面的程序<cewolf:data>上加入:
<cewolf:colorpaint color="#FFEEEE"/>
指定图的背景色。
也可以:
<cewolf:gradientpaint>
<cewolf:point x="0" y="0" color="#FFFFFF" />
<cewolf:point x="300" y="0" color="#DDDDFF" />
</cewolf:gradientpaint>
这样指定渐变色。
甚至
<cewolf:texturepaint image="/img/bg.jpg" width="60" height="60" />
指定背景图。
而在另一个JSP页面里显示:
<%@include file='graph.jsp'%>
这样就把上面生成线图的JSP页面应用到当前JSP页面里。
也许你疑问为何用这个tld呢?因为这样嵌入了图表的JSP就不用使用任何Java代码。
记得将cewolf.tld放在web-inf下面。
在xml里追加:
<
servlet
>
2
3
<
servlet-name
>
CewolfServlet
</
servlet-name
>
4
5
<
servlet-class
>
de.laures.cewolf.CewolfRenderer
</
servlet-class
>
6
7
<!--
sets storage implementation
-->
8
9
<
init-param
>
10
11
<
param-name
>
storage
</
param-name
>
12
13
<
param-value
>
de.laures.cewolf.storage.TransientSessionStorage
</
param-value
>
14
15
</
init-param
>
16
17
<!--
sets overlib.js location relative to webapp
-->
18
19
<
init-param
>
20
21
<
param-name
>
overliburl
</
param-name
>
22
23
<
param-value
>
overlib.js
</
param-value
>
24
25
</
init-param
>
26
27
<!--
turn on or off debugging logging
-->
28
29
<
init-param
>
30
31
<
param-name
>
debug
</
param-name
>
32
33
<
param-value
>
true
</
param-value
>
34
35
</
init-param
>
36
37
<
load-on-startup
>
1
</
load-on-startup
>
38
39
</
servlet
>
40
41
<
servlet-mapping
>
42
43
<
servlet-name
>
CewolfServlet
</
servlet-name
>
44
45
<
url-pattern
>
/cewolf/*
</
url-pattern
>
46
47
</
servlet-mapping
>
48
49
将overlib.js复制到WEB应用程序的根目录下;
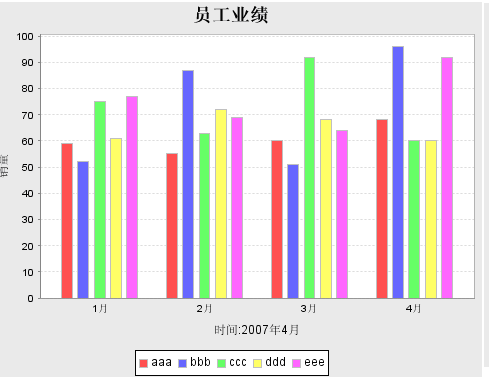
verticalBar类型和line类型可以直接换 。不需要改其他地方。
效果图对比:
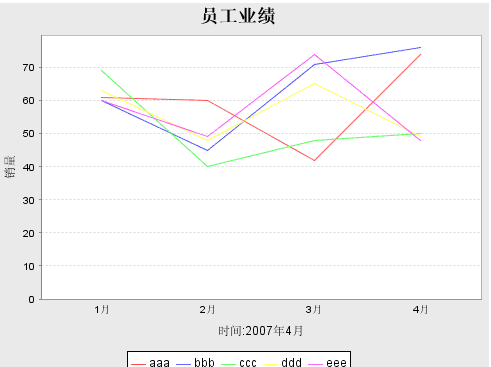
只是类型变了(加上了背景色效果):
加点背景图片:(加了个半裸女,可惜挡住了。呵呵)
五、JS CHART
随后我又在http://webfx.eae.net/发现一个用js写的chart开源工具包。
要用到报表的地方:
<div id="chart2" class="chart" style="width: 400px; height: 200px;"></div>
而在HTMLhead部分导入需要的JS 文件。参考其提供的demo文件,稍做修改就能完全使用。
<!
DOCTYPE html PUBLIC "-//W3C//DTD XHTML 1.0 Transitional//EN" "http://www.w3.org/TR/xhtml1/DTD/xhtml1-transitional.dtd"
>
2
3
<
html
xmlns
="http://www.w3.org/1999/xhtml"
xml:lang
="en"
lang
="en"
>
4
5
<
head
>
6
7
<
title
>
Chart Demo (WebFX)
</
title
>
8
9
<
meta
http-equiv
="Content-Type"
content
="text/html; charset=utf-8"
/>
10
11
<
script
type
="text/javascript"
src
="includes/excanvas.js"
></
script
>
12
13
<
script
type
="text/javascript"
src
="includes/wz_jsgraphics.js"
></
script
>
14
15
<
script
type
="text/javascript"
src
="includes/chart.js"
></
script
>
16
17
<
script
type
="text/javascript"
src
="includes/canvaschartpainter.js"
></
script
>
18
19
<
script
type
="text/javascript"
src
="includes/jgchartpainter.js.js"
></
script
>
20
21
<
script
type
="text/javascript"
src
="includes/demo.js"
></
script
>
22
23
<
link
rel
="stylesheet"
type
="text/css"
href
="includes/canvaschart.css"
/>
24
25
<
style
type
="text/css"
>
26
27
.chart {}{ margin-left: 20px; }28
29
</
style
>
30
31
</
head
>
32
33
<
body
onload
="demo();"
>
34
35
<
div
class
="webfx-main-body"
>
36
37
<
div
id
="chart3"
class
="chart"
style
="width: 400px; height: 200px;"
></
div
>
38
39
</
div
>
40
41
</
body
>
42
43
</
html
>
44
负责绘制工作的js:
function
demo()
{2
3
var c = new Chart(document.getElementById('chart3'));4
5
c.setDefaultType(CHART_LINE);6
7
c.setGridDensity(10, 10);8
9
c.setHorizontalLabels(['mon', 'tue', 'wed', 'thu', 'fri', 'sat', 'sun', 'mon', 'tue', 'wed']);10
11%


 被折叠的 条评论
为什么被折叠?
被折叠的 条评论
为什么被折叠?
 到【灌水乐园】发言


