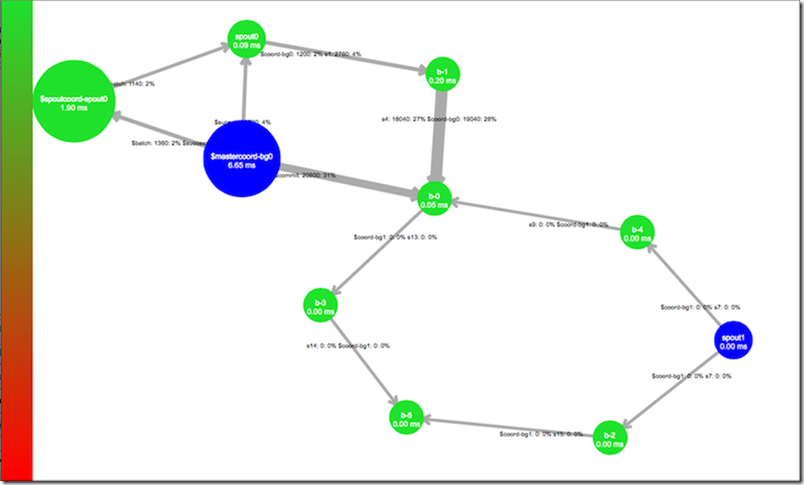
In the visualization, spout components are represented as blue, while bolts are colored between green and red depending on their associated capacity metric. The width of the lines between the components represent the flow of tuples relative to the other visible streams.
storm ui 中的topology可视化的中的指标说明:
spout: 用蓝色的球表示
bolt: 用绿色到红色的球表示,绿色到红色代表了该bolt并行度(capacity metric )相关的指标。
组件之间的线的宽度:数据流的大小(组件之间的线的宽度代表元组数据流相对于其他可见的流)。
组件球的半径大小:
组件上线上的数字:相关联两个组件上传输的数据量trans,百分比为 (trans /totaltrans)*100%, totaltrans是所有组件间传输的数据量的总和。


 本文详细解析了Storm UI中Topology可视化的各项指标含义。包括如何通过颜色区分Spout与Bolt组件,线条宽度代表的数据流大小,以及组件球的半径大小所体现的容量指标等。


 被折叠的 条评论
为什么被折叠?


