


 本文详细介绍了Chrome开发者工具中的一些实用技巧,包括快速定位CSS样式、查看XHR请求、跟踪定时器设置位置、简化事件监听器调试、跳转特定文件与函数、搜索文件内容、批量编辑代码、本地文件编辑直接保存、XPath表达式评估等功能,同时推荐了两个实用的Chrome扩展JSONView和JSErrorNotifier,以及如何避免在第三方库中打断点,提高开发效率。
Re-posted from Chrome Devtools Tips & Tricks.
中文版: Chrome 开发者工具的技巧
Lately I’ve spent more time than usual using the Chrome Developer Tools. Along the way I found a couple of nice features that I had previously missed (or at least hadn’t needed enough to look for; e.g. blackboxing and asynchronous stacktraces). Because of this, I wanted to summarized a few of the features that I really like about devtools.
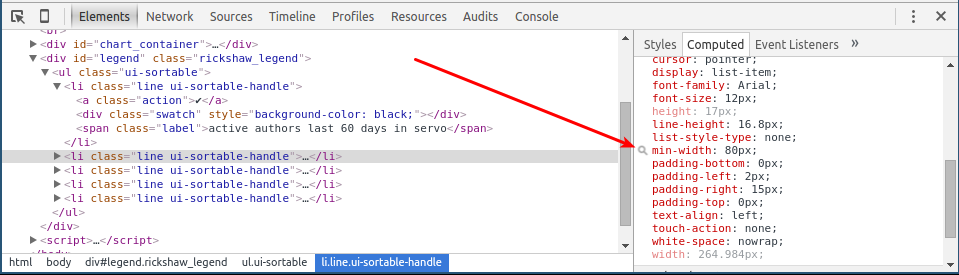
- The little magnifier glass icon that shows you which CSS class/selector in what CSS file that ultimately decides the styling for a specific element and CSS property. For example, select “inspect” on any DOM element and then switch to the “Computed” sub-tab to the right. Find the CSS property you’re interested in and clicking the magnifier icon takes you straight to the correct CSS class/selector in the right .css file (very useful when you start out working on a new large web app):
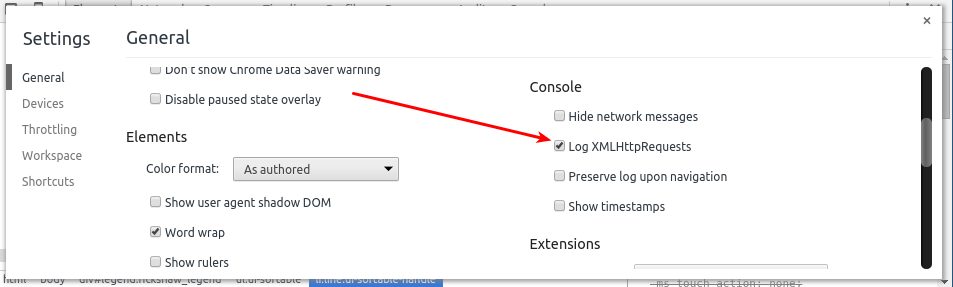
- To see what XHRs the web app sends while you’re using it, check the “Log XMLHttpRequests” checkbox under “Settings” and keep an eye on the console tab. Before I knew about this, I would set up my browser to go through an HTTP intercept proxy like Burp suite but this more convenient if you just want an quick overview. Of course, with an intercept proxy you also get the opportunity to modify the XHRs before they reach the server, which is really nice for security testing. A lightweight alternative to that is to look under “Sources :: XHR Breakpoints” and activate the “Any XHR” breakpoint.
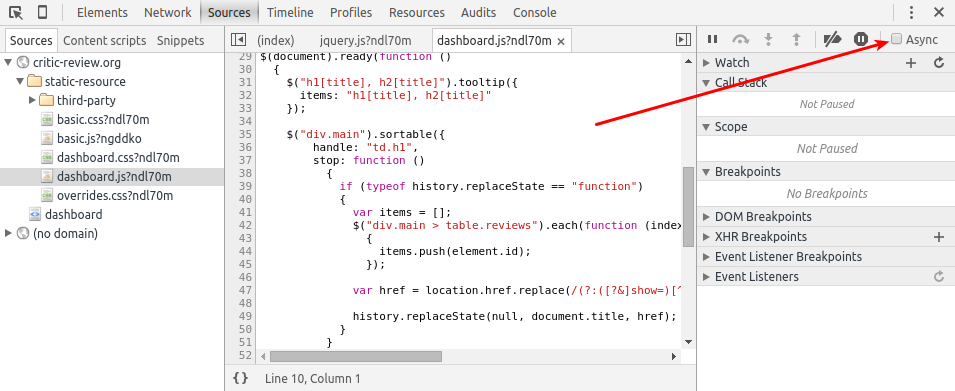
- Now, suppose that the web app you’re working on is making some XHR at a regular interval (for example, keeping the current view up to date) and you would like to know where this timer is setup (i.e. where the call to
setTimeout()or possiblysetInterval()is made). To figure this out, you switch to the “Sources” tab, and check the “Async” checkbox. This will make all your stacktraces continue beyondsetTimeout()and friends, even multiple levels deep. It does the same thing forrequestAnimationFrame()andaddEventListener()and a few others too. You’ll find the checkbox here:
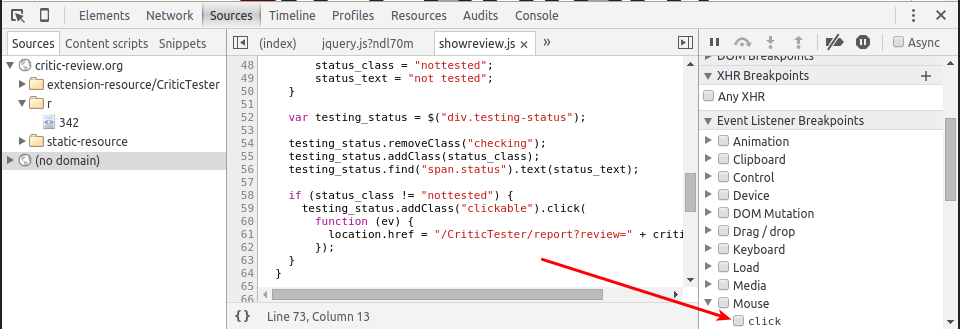
- To quickly find the code that runs when you click a particular button or link is clicked, activate an “Event listener breakpoint” for Mouse :: Click just before you click the particular button (another killer feature when starting out work on an existing large web app):
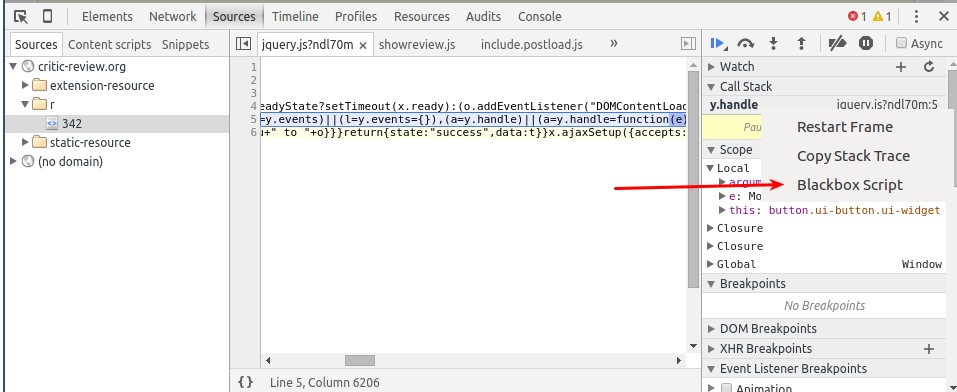
- When you use “Event listener breakpoint :: Mouse :: Click” you might end up in a third-party library like jQuery at first, and so you’d have to step a few times in the debugger to arrive at the “real” event handler. A great way to avoid this is to “blackbox” the third-party script. The debugger will never stop inside a blackboxed script, instead it continues to run until it reaches a line that isn’t in a blackboxed file. You can blackbox a script by right clicking the filename of the third-party library in the callstack and the selecting “Blackbox Script” from the context menu:
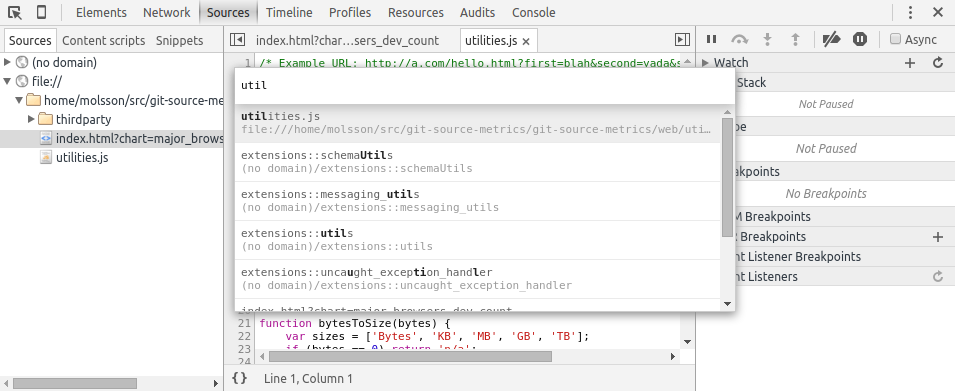
- You can jump to a specific file, by name, using
ctrl-p(just like in atom):
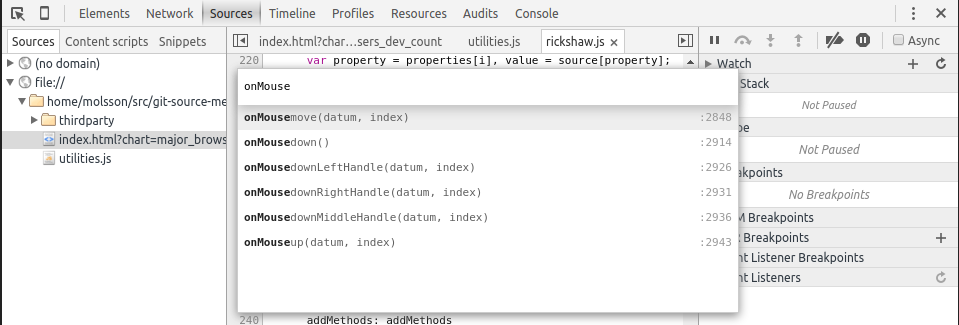
- You can jump to a function, by name (but only in the currently open file), using
ctrl-shift-p:
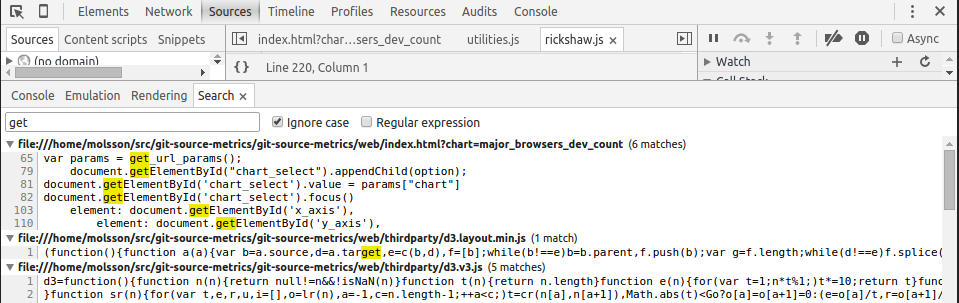
- You can search through all files using
ctrl-shift-f:
- You can edit using multiple simultaneous cursors by selecting some word and then pressing
ctrl-da few times to select more instances of that word (again, just like in atom). Very nice for renaming variables:
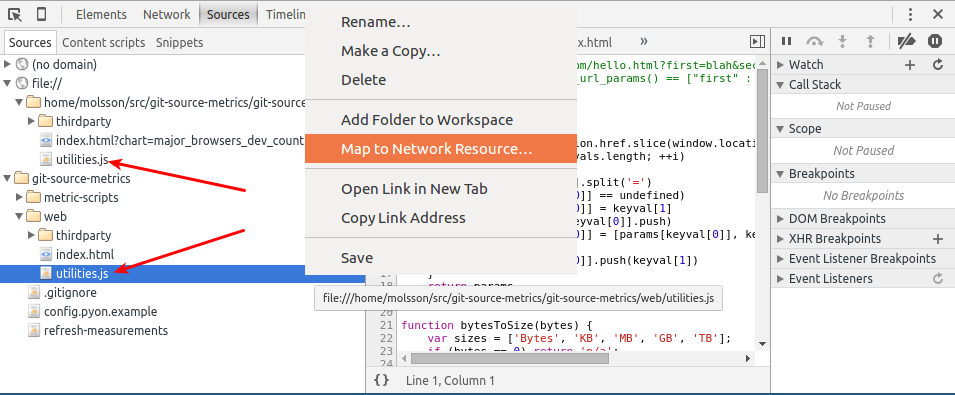
- When working on a website stored locally it’s possible to edit files in devtools and save the changes directly to disk. To do this, switch to the Sources tab, right click on the Sources sub-tab and select “Add Folder to Workspace” and then finally select the local folder where your project is located. After that, right click the local copy of some file in your site and select “Map to Network Resource…” and then select the corresponding “network” file:
Other handy tips include:
$0in console is the element you selected in the elements view.- You can evaluate XPath expressions using
$x("//p")(very useful if you’re writing selenium testcases and CSS selectors doesn’t get you all the way).
I also recommend that you install two Chrome extensions:
JSONView will indent and syntax highlight JSON blobs for you (and even allow you to expand/collapse blocks). It also makes URLs inside JSON clickable which often makes it possible to explore a JSON-based API via the browser. For example, try navigating to
http://omahaproxy.appspot.com/all.jsonbefore and after you install it (better formatting) and alsohttps://api.github.com/(clickable URLs make it easier to explore the API).JS Error Notifier (non-“spyware” version) creates a popup each time a Javascript error is printed to the console. Unfortunately, the main version of this extension submits private “usage data” to a third-party service (see discussion in issue #28). But at any rate, this extension has helped me notice and fix several bugs.
All in all I really like devtools, the only annoying thing that I can think of is that you cannot customize keybindings:


 1512
1512

 被折叠的 条评论
为什么被折叠?
被折叠的 条评论
为什么被折叠?
 到【灌水乐园】发言


