


 本文详细介绍KMeans聚类算法的原理与实现过程,通过Python代码实现并展示聚类效果。
kmeans算法思想:
1.从数据集中随机选取k个初始点作为质心。
2.遍历数据集中所有的点,求出每个点到每个质心的距离,找出距离改点最近的质心,并改变此点类型为此质点的类型。
3.重新为每个类别更新其质心。
4.重复2,3,步直到最后两次质心位置相同退出while循环。
补充用python实现的代码,要给python装numpy和matplotlib库,建议直接装anaconda,装好了anaconda默认安装了spyder,里面集成了这两个库,比较方便。
建立kmeans.py文件,编写如下代码:
# -*- coding: utf-8 -*-
from numpy import *
import matplotlib.pyplot as plt

#计算两向量之间的欧式距离,在这里是计算两点之间的距离
def euclDistance(vector1,vector2):
    return sqrt(sum(power(vector2-vector1,2)))

#初始化......
#从原始数据中产生随机的k个数据存入centroids
def initCentroids(dataSet,k):
    numSamples,dim=dataSet.shape#返回dataSet的行和列
    centroids=zeros((k,dim))#创建k行dim列的矩阵
    for i in range(k):
        index=int(random.uniform(0,numSamples))#从0到numSamples中随机产生一个数
        centroids[i,:]=dataSet[index,:]
    return centroids

def kmeans(dataSet,k):#此算法用到3个数据集,dataSet:n行两列表示原始数据,clusterAssment:n行两列,第一列表示
                      #原始数据的类型,第二列表示此点到质心的距离,centriods:k行两列表示点群的质心
    numSamples=dataSet.shape[0]
    clusterAssment=mat(zeros((numSamples,2)))#clusterAssment中存放点聚类的类别以及与该类别质心的距离
    clusterChanged=True
    centroids=initCentroids(dataSet,k)#从原始数据中产生随机的k个数据存入centroids,代表k个质心
    while clusterChanged:
        clusterChanged=False
        for i in xrange(numSamples):
            minDist=100000.0
            minIndex=0
            for j in range(k):#从k个质心中选取距离i行这个点最小的一个质心
                distance=euclDistance(centroids[j,:],dataSet[i,:])
                if distance<minDist:
                    minDist=distance
                    minIndex=j

            if clusterAssment[i,0]!=minIndex:
                clusterChanged=True#直到对于所有的原始数据类别都确定,都不再更新,即
                                   #(所有的clusterAssment[i,0]都等于minIndex)。此标志为false,退出while循环
                clusterAssment[i,:]=minIndex,minDist**2

        for j in range(k):#更新每个点群的质心
            pointsInCluster=dataSet[nonzero(clusterAssment[:,0]==j)[0]]#选取j类的所有点存入pointsInCluster,这里nonzero函数是个难点,可以百度一下
            centroids[j,:]=mean(pointsInCluster,axis=0)#对pointInCluster中的数据按列求均值


    #kmeans算法不包括这里的代码,这里的代码主要是可以打印清楚质心的移动情况
        mark=['or', 'ob', 'og', 'ok', '^r', '+r', 'sr', 'dr', '<r', 'pr']
        #画聚类后的图
        for i in xrange(numSamples):
            markIndex=int(clusterAssment[i,0])
            plt.plot(dataSet[i,0],dataSet[i,1],mark[markIndex],markersize=6)
        mark=['Dr', 'Db', 'Dg', 'Dk', '^b', '+b', 'sb', 'db', '<b', 'pb']
    #画质心
        for i in range(k):
            plt.plot(centroids[i,0],centroids[i,1],mark[i],markersize=12)
        plt.show()


    print "聚类完成"
    return centroids,clusterAssment

def showCluster(dataSet,k,centroids,clusterAssment):
    numSamples,dim=dataSet.shape
    if dim!=2:
        print "Sorry! I can not draw because the dimension of your data is not 2!"
        return 1
    mark=['or', 'ob', 'og', 'ok', '^r', '+r', 'sr', 'dr', '<r', 'pr']
    if k>len(mark):
        print "Sorry! Your k is too large! please contact Zouxy"
        return 1
    #画聚类后的图
    for i in xrange(numSamples):
        markIndex=int(clusterAssment[i,0])
        plt.plot(dataSet[i,0],dataSet[i,1],mark[markIndex],markersize=6)
    mark=['Dr', 'Db', 'Dg', 'Dk', '^b', '+b', 'sb', 'db', '<b', 'pb']
    #画质心
    for i in range(k):
        plt.plot(centroids[i,0],centroids[i,1],mark[i],markersize=12)
    plt.show()
本程序所用到的数据集为80个点,可以复制到自己的test.txt文档中与此程序放在同一目录下:
    1.658985,4.285136
    -3.453687,3.424321
    4.838138,-1.151539
    -5.379713,-3.362104
    0.972564,2.924086
    -3.567919,1.531611
    0.450614,-3.302219
    -3.487105,-1.724432
    2.668759,1.594842
    -3.156485,3.191137
    3.165506,-3.999838
    -2.786837,-3.099354
    4.208187,2.984927
    -2.123337,2.943366
    0.704199,-0.479481
    -0.392370,-3.963704
    2.831667,1.574018
    -0.790153,3.343144
    2.943496,-3.357075
    -3.195883,-2.283926
    2.336445,2.875106
    -1.786345,2.554248
    2.190101,-1.906020
    -3.403367,-2.778288
    1.778124,3.880832
    -1.688346,2.230267
    2.592976,-2.054368
    -4.007257,-3.207066
    2.257734,3.387564
    -2.679011,0.785119
    0.939512,-4.023563
    -3.674424,-2.261084
    2.046259,2.735279
    -3.189470,1.780269
    4.372646,-0.822248
    -2.579316,-3.497576
    1.889034,5.190400
    -0.798747,2.185588
    2.836520,-2.658556
    -3.837877,-3.253815
    2.096701,3.886007
    -2.709034,2.923887
    3.367037,-3.184789
    -2.121479,-4.232586
    2.329546,3.179764
    -3.284816,3.273099
    3.091414,-3.815232
    -3.762093,-2.432191
    3.542056,2.778832
    -1.736822,4.241041
    2.127073,-2.983680
    -4.323818,-3.938116
    3.792121,5.135768
    -4.786473,3.358547
    2.624081,-3.260715
    -4.009299,-2.978115
    2.493525,1.963710
    -2.513661,2.642162
    1.864375,-3.176309
    -3.171184,-3.572452
    2.894220,2.489128
    -2.562539,2.884438
    3.491078,-3.947487
    -2.565729,-2.012114
    3.332948,3.983102
    -1.616805,3.573188
    2.280615,-2.559444
    -2.651229,-3.103198
    2.321395,3.154987
    -1.685703,2.939697
    3.031012,-3.620252
    -4.599622,-2.185829
    4.196223,1.126677
    -2.133863,3.093686
    4.668892,-2.562705
    -2.793241,-2.149706
    2.884105,3.043438
    -2.967647,2.848696
    4.479332,-1.764772
    -4.905566,-2.911070
测试文件a.py:
# -*- coding: utf-8 -*-
"""
Created on Sun Mar 5 12:30:11 2017
@author: chao
"""
from numpy import *
import kmeans
## 读数据
print "step 1: load data..."
dataSet = []
fileIn = open('/home/chao/Desktop/python_work/kmeans/test.txt')
for line in fileIn.readlines():
lineArr = line.strip().split(',')
dataSet.append([float(lineArr[0]), float(lineArr[1])]) #将每一组数据读入列表里面
## 聚类
print "step 2: clustering..."
dataSet = mat(dataSet) #mat函数创建矩阵
k = 4
centroids, clusterAssment = kmeans.kmeans(dataSet, k)
## 画出结果图
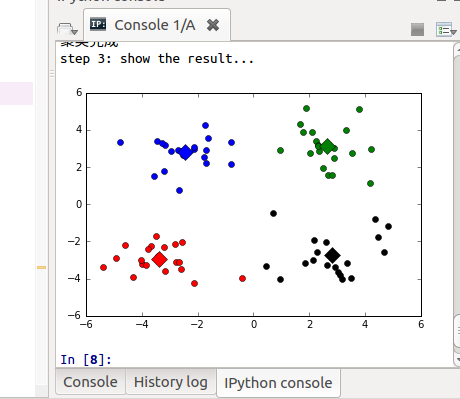
print "step 3: show the result..."
kmeans.showCluster(dataSet, k, centroids, clusterAssment)
运行结果图:


 3268
3268

 被折叠的 条评论
为什么被折叠?
被折叠的 条评论
为什么被折叠?
 到【灌水乐园】发言


