


 本文介绍了一种使用Python进行网页数据抓取的方法,并通过BeautifulSoup解析HTML内容。随后利用NLTK和WordCloud等工具对抓取的数据进行文本分析及可视化展示。
#采集
import urllib.request
response = urllib.request.urlopen('http://php.net/')
html = response.read()
#简单处理
from bs4 import BeautifulSoup
soup = BeautifulSoup(html,"html5lib")
text = soup.get_text(strip=True)
tokens = text.split()
#过滤、清洗
from wordcloud import WordCloud , STOPWORDS , ImageColorGenerator
import matplotlib.pyplot as plt
clean_tokens = list()
sr = STOPWORDS.copy()
sr.add('The')
sr.add('This')
for token in tokens:
if token not in sr:
clean_tokens.append(token)
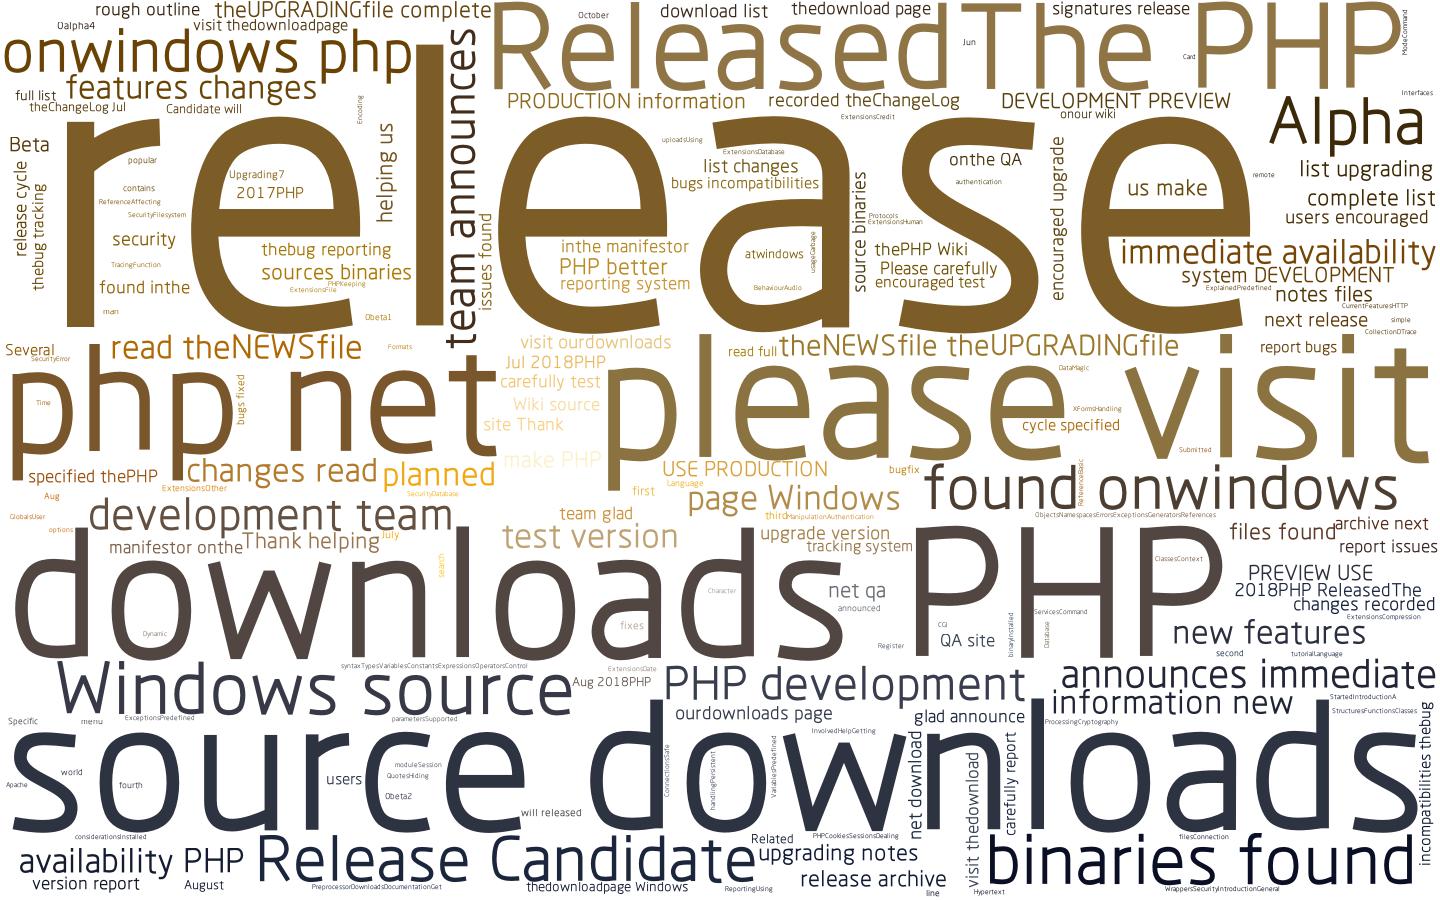
#云图
backgroud_Image = plt.imread( 'C:\\Users\\daniel\\Desktop\\1.jpg' )
wc = WordCloud ( width = 1024 , height = 768 , background_color = 'white' , mask = backgroud_Image , font_path = "C:\\Users\\daniel\\Desktop\\rht.otf" , stopwords = sr , max_font_size = 400 , random_state = 50 )
wc.generate_from_text ( text )
img_colors = ImageColorGenerator ( backgroud_Image )
wc . recolor ( color_func = img_colors )
plt . imshow ( wc )
plt . axis ( 'off' )
#不显示坐标轴
plt . show ()
#保存结果到本地
wc . to_file ( 'php.jpg' )
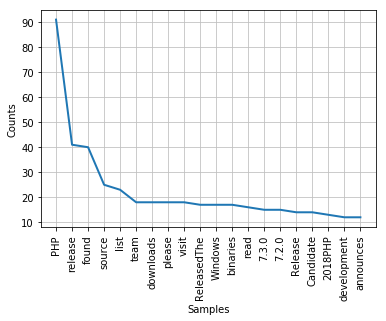
#线性图
import nltk
freq = nltk.FreqDist(clean_tokens)
freq.plot(20, cumulative=False)
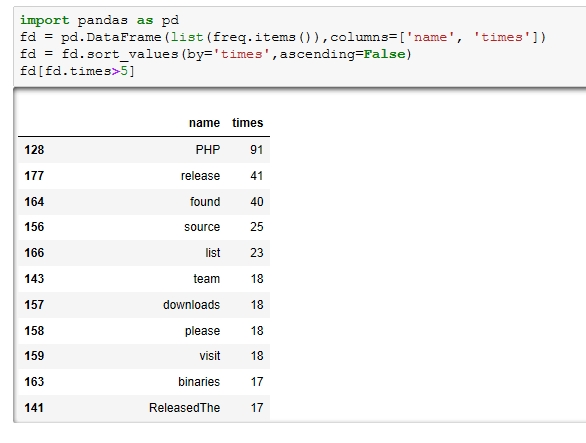
#数据表格
import pandas as pd
fd = pd.DataFrame(list(freq.items()),columns=['name', 'counts'])
fd = fd.sort_values(by='counts',ascending=False)
fd[fd.counts>5]


 被折叠的 条评论
为什么被折叠?
被折叠的 条评论
为什么被折叠?
 到【灌水乐园】发言


