


 博客围绕直方图中最大矩形问题展开,给出了时间和内存限制以及提交与通过情况。求解方法是求每个长方形的高在哪个区间是最小值,使用单调递增栈,最后遍历一遍即可。
Largest Rectangle in a Histogram
Time Limit: 2000/1000 MS (Java/Others) Memory Limit: 65536/32768 K (Java/Others)
Total Submission(s): 26202 Accepted Submission(s): 8255
Problem Description
A histogram is a polygon composed of a sequence of rectangles aligned at a common base line. The rectangles have equal widths but may have different heights. For example, the figure on the left shows the histogram that consists of rectangles with the heights 2, 1, 4, 5, 1, 3, 3, measured in units where 1 is the width of the rectangles:
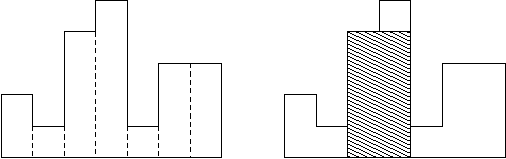
Usually, histograms are used to represent discrete distributions, e.g., the frequencies of characters in texts. Note that the order of the rectangles, i.e., their heights, is important. Calculate the area of the largest rectangle in a histogram that is aligned at the common base line, too. The figure on the right shows the largest aligned rectangle for the depicted histogram.
Usually, histograms are used to represent discrete distributions, e.g., the frequencies of characters in texts. Note that the order of the rectangles, i.e., their heights, is important. Calculate the area of the largest rectangle in a histogram that is aligned at the common base line, too. The figure on the right shows the largest aligned rectangle for the depicted histogram.
Input
The input contains several test cases. Each test case describes a histogram and starts with an integer n, denoting the number of rectangles it is composed of. You may assume that 1 <= n <= 100000. Then follow n integers h1, ..., hn, where 0 <= hi <= 1000000000. These numbers denote the heights of the rectangles of the histogram in left-to-right order. The width of each rectangle is 1. A zero follows the input for the last test case.
Output
For each test case output on a single line the area of the largest rectangle in the specified histogram. Remember that this rectangle must be aligned at the common base line.
Sample Input
7 2 1 4 5 1 3 3 4 1000 1000 1000 1000 0
Sample Output
8 4000
Source
Recommend
LL
求每个长方形的高在哪个区间是最小值 单调递增栈
然后遍历一遍就行了
#include <iostream>
#include <cstdio>
#include <sstream>
#include <cstring>
#include <map>
#include <cctype>
#include <set>
#include <vector>
#include <stack>
#include <queue>
#include <algorithm>
#include <list>
#include <cmath>
#include <bitset>
#define rap(i, a, n) for(int i=a; i<=n; i++)
#define rep(i, a, n) for(int i=a; i<n; i++)
#define lap(i, a, n) for(int i=n; i>=a; i--)
#define lep(i, a, n) for(int i=n; i>a; i--)
#define rd(a) scanf("%d", &a)
#define rlld(a) scanf("%lld", &a)
#define rc(a) scanf("%c", &a)
#define rs(a) scanf("%s", a)
#define rb(a) scanf("%lf", &a)
#define rf(a) scanf("%f", &a)
#define pd(a) printf("%d\n", a)
#define plld(a) printf("%lld\n", a)
#define pc(a) printf("%c\n", a)
#define ps(a) printf("%s\n", a)
#define MOD 2018
#define LL long long
#define ULL unsigned long long
#define Pair pair<int, int>
#define mem(a, b) memset(a, b, sizeof(a))
#define _  ios_base::sync_with_stdio(0),cin.tie(0)
//freopen("1.txt", "r", stdin);
using namespace std;
const int maxn = 110000, INF = 0x7fffffff;

struct node
{
    int id, l, r;
    LL w;
}Node[maxn];

stack<node> S;
int main()
{
    int n;
    while(scanf("%d", &n) != EOF && n)
    {
        for(int i = 1; i <= n; i++)
        {
            rlld(Node[i].w);
            Node[i].id = i;
            Node[i].l = i;
            while(!S.empty() && S.top().w > Node[i].w)
            {
                Node[S.top().id].r = i;
                Node[i].l = Node[S.top().id].l;

                S.pop();
            }
            S.push(Node[i]);
        }
        while(!S.empty())
        {
            Node[S.top().id].r = n + 1;
            S.pop();
        }


        LL mx = -INF;
        for(int i = 1; i <= n; i++)
        {
            mx = max(mx, (LL)(Node[i].r - Node[i].l) * Node[i].w);
        }
        printf("%lld\n", mx);
    }

    return 0;
}
Largest Rectangle in a Histogram
Time Limit: 2000/1000 MS (Java/Others) Memory Limit: 65536/32768 K (Java/Others)
Total Submission(s): 26202 Accepted Submission(s): 8255
Problem Description
A histogram is a polygon composed of a sequence of rectangles aligned at a common base line. The rectangles have equal widths but may have different heights. For example, the figure on the left shows the histogram that consists of rectangles with the heights 2, 1, 4, 5, 1, 3, 3, measured in units where 1 is the width of the rectangles:
Usually, histograms are used to represent discrete distributions, e.g., the frequencies of characters in texts. Note that the order of the rectangles, i.e., their heights, is important. Calculate the area of the largest rectangle in a histogram that is aligned at the common base line, too. The figure on the right shows the largest aligned rectangle for the depicted histogram.
Usually, histograms are used to represent discrete distributions, e.g., the frequencies of characters in texts. Note that the order of the rectangles, i.e., their heights, is important. Calculate the area of the largest rectangle in a histogram that is aligned at the common base line, too. The figure on the right shows the largest aligned rectangle for the depicted histogram.
Input
The input contains several test cases. Each test case describes a histogram and starts with an integer n, denoting the number of rectangles it is composed of. You may assume that 1 <= n <= 100000. Then follow n integers h1, ..., hn, where 0 <= hi <= 1000000000. These numbers denote the heights of the rectangles of the histogram in left-to-right order. The width of each rectangle is 1. A zero follows the input for the last test case.
Output
For each test case output on a single line the area of the largest rectangle in the specified histogram. Remember that this rectangle must be aligned at the common base line.
Sample Input
7 2 1 4 5 1 3 3 4 1000 1000 1000 1000 0
Sample Output
8 4000
Source
Recommend
LL


 227
227

 被折叠的 条评论
为什么被折叠?
被折叠的 条评论
为什么被折叠?
 到【灌水乐园】发言


