8.1 Bayesian Networks
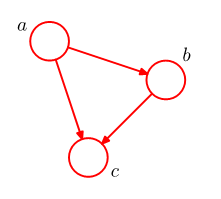
对应的directed graphical model为
在joint distribution分解过程中,对称性丧失。
Fully connected graph: link between every pair of nodes (not interesting)
Absence of links (interesting): information about the properties of the classes of distributions represented by the graph.
Joint distribution可以分解为:
(1) The key equation expresses the factorization properties of the joint distribution for a directed graphical model.
(2) 限制条件:Directed acyclic graphs (DAGs)
8.1.1 Example: Polynomial regression
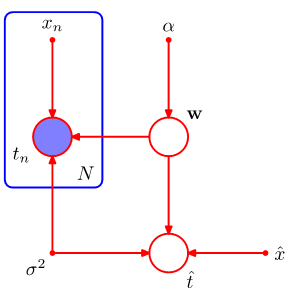
Bayesian polynomial regression
- Polynormial coefficients: w
- Observed data: t
- Input data: x
- Noise variance: σ2
- Hyperparameter: α
其中random variables有w和t,而parameters为x, σ2和α
Joint distribution of the random variables:
Predictive distribution:
8.1.2 Generative models
Ancestral sampling
(1) Sampling from joint distribution;
- Sample from lower numbered node to higher numbered node.
(2) Sampling from marginal distribution
- Sample from full joint distribution and only keep the values for required variables.
The primary role of latent variables: decompose complicated distribution over observed variables into simpler conditional distributions
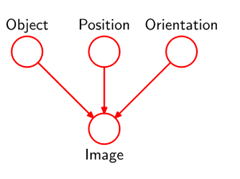
例子--图像识别:
其中Object为discrete variable, 而Position和Orientation为continuous variables,最终目的是
The model describes the causal process to generate observed data, therefore, it is called generative model. In polynomial regression model, the observed variable x is not generated by default, so the model is not generative.
8.1.3 Discrete variables
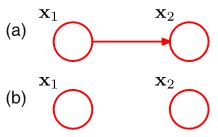
Two K-state discrete variables:
由于constraint ![]() , (a)需要 K 2 – 1 parameters, (b)需要 2(K – 1) parameters
, (a)需要 K 2 – 1 parameters, (b)需要 2(K – 1) parameters
For fully connected graph of M discrete variables, 有K M – 1 parameters. 控制模型的参数数量有如下几种方法:
(a) 选择具有合适connectivity的图结构:
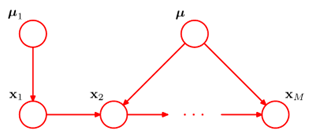
The chain of M discrete variables:
共需要K – 1 + (M – 1) K (K – 1) parameters.
(b) sharing parameters:
μ is shared by all of the conditional distributions p(xi| xi – 1), 共需要K 2 – 1 parameters.
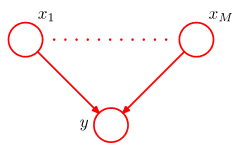
(c) 使用参数模型
共需要2M + 1 parameters
8.1.4 Linear-Gaussian models
The conditional distribution for each node:
可以求得单个变量的mean和covariance:
从公式中可以看出,mean和covariance都可以表达为recursive form,这有助于推导joint distribution的mean和covariance.
Joint distribution是multivariate Gaussian distribution:
例子:
扩展:
若每个node都是multivariate Gaussian variable,
其joint distribution也为Gaussian


 本文探讨了贝叶斯网络及其对应的有向图模型,包括联合分布的分解过程及模型特性。文中详细介绍了多项式回归的贝叶斯模型,并讨论了生成模型的概念及其在图像识别中的应用。此外,还分析了离散变量与线性高斯模型在不同场景下的应用。






 被折叠的 条评论
为什么被折叠?


