 离散信号重构


 本文通过两个不同的采样间隔,展示了如何使用零阶保持和一阶保持方法从离散时间信号重构连续时间信号,并通过MATLAB代码及图表详细解释了整个过程。
代码:
% Discrete-time Signal x1(n) : Ts = 0.0002
Ts = 0.0002; n = -25:1:25; nTs = n*Ts; x1 = exp(-1000*abs(nTs));
figure('NumberTitle', 'off', 'Name', 'Example3.23 Reconstructed From x1(n)');
set(gcf,'Color','white');
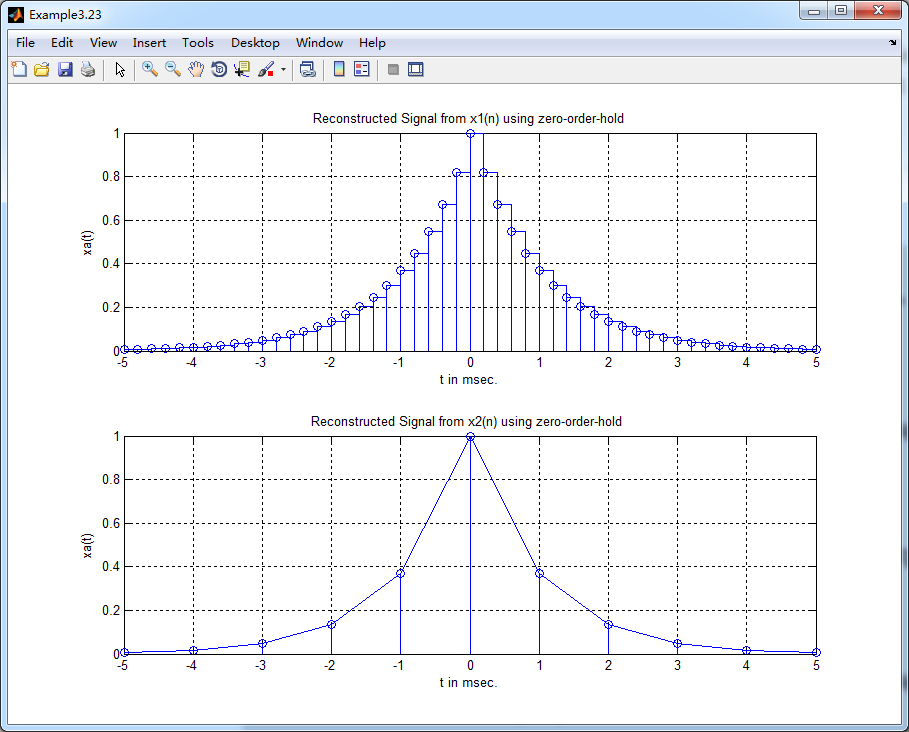
subplot(2,1,1); stairs(nTs*1000,x1); grid on; %axis([0,1,0,1.5]); % Zero-Order-Hold
title('Reconstructed Signal from x1(n) using zero-order-hold');
xlabel('t in msec.'); ylabel('xa(t)'); hold on;
stem(n*Ts*1000,x1); hold off;
subplot(2,1,2); plot(nTs*1000,x1); grid on; %axis([0,1,0,1.5]); % first-Order-Hold
title('Reconstructed Signal from x1(n) using first-Order-Hold');
xlabel('t in msec.'); ylabel('xa(t)'); hold on;
stem(n*Ts*1000,x1); hold off;
% Discrete-time signal x2(n) : Ts=0.001
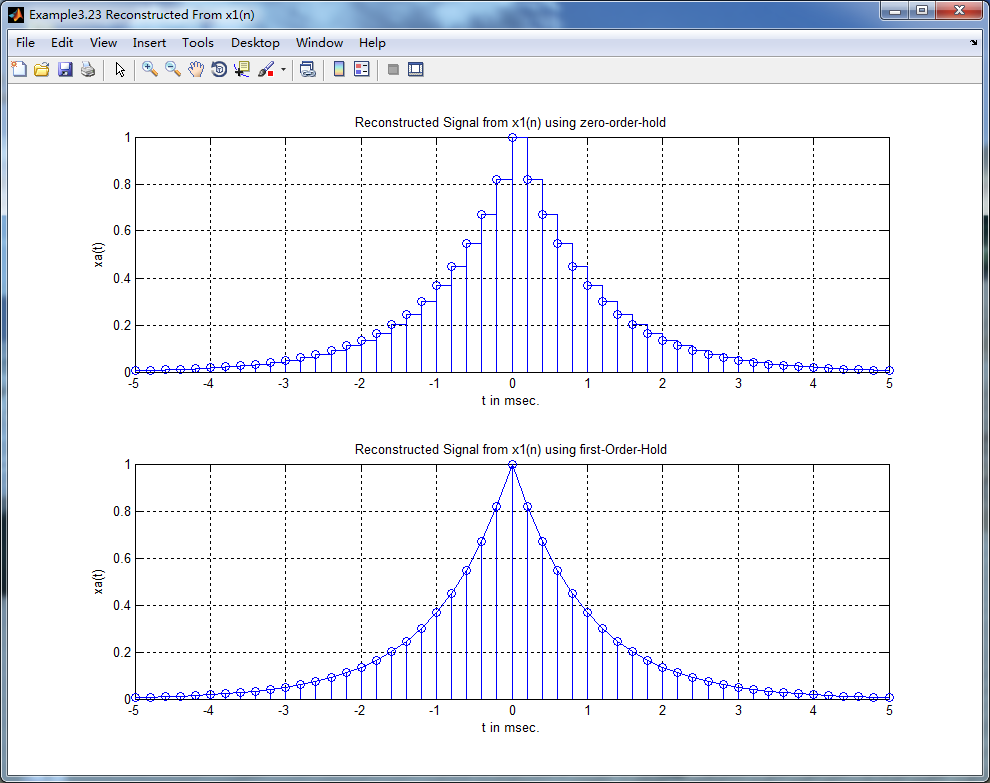
Ts = 0.001; n = -5:1:5; nTs = n*Ts; x2 = exp(-1000*abs(nTs));
% Plot
figure('NumberTitle', 'off', 'Name', 'Example3.23 Reconstructed From x2(n)');
set(gcf,'Color','white');
subplot(2,1,1); stairs(nTs*1000, x2); grid on; % axis([-1,1,-1,1]); % Zero-Order-Hold
title('Reconstructed Signal from x2(n) using zero-order-hold ');
xlabel('t in msec.'); ylabel('xa(t)'); hold on;
stem(n*Ts*1000,x2); hold off;
subplot(2,1,2); plot(nTs*1000, x2); grid on; % axis([-1,1,-1,1]); % First-Order-Hold
title('Reconstructed Signal from x2(n) using first-order-hold ');
xlabel('t in msec.'); ylabel('xa(t)'); hold on;
stem(n*Ts*1000,x2); hold off;
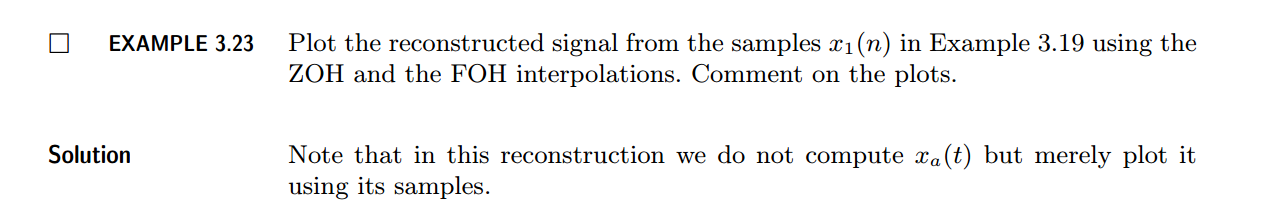
运行结果:


 被折叠的 条评论
为什么被折叠?
被折叠的 条评论
为什么被折叠?
 到【灌水乐园】发言


