


 本文提供了ECharts中四种常见图表的详细配置实例:折线图(区域)、柱状图、饼状图及地图。每种图表都展示了具体的代码实现方式,并通过设置不同属性实现了丰富的视觉效果,便于开发者快速上手。
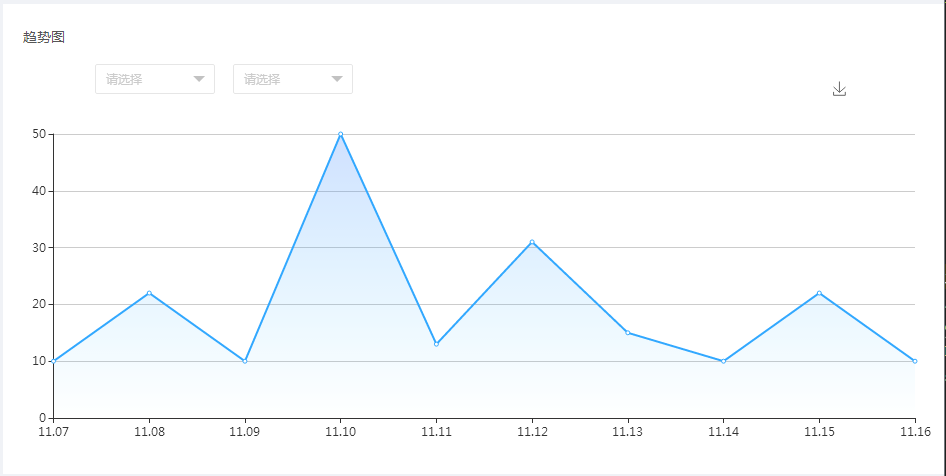
1.折线图(区域)
var myChartLine = echarts.init(document.getElementById('chart1'));
optionLine = {
    tooltip: {
        trigger: 'axis'
    },
    lineStyle:{
        normal:{
            color:'#32A8FF'
        }
    },
    areaStyle:{
        normal:{
//颜色渐变函数 前四个参数分别表示四个位置依次为左、下、右、上
color: new echarts.graphic.LinearGradient(0, 0, 0, 1, [{
                offset: 0,
                color: 'rgba(80,141,255,0.39)'
            }, {
                offset: .34,
                color: 'rgba(56,155,255,0.25)'
            },{
                offset: 1,
                color: 'rgba(38,197,254,0.00)'
            }])

        }
    },
    grid: {
        left: '3%',
        right: '4%',
        bottom: '9%',
        containLabel: true
    },
    toolbox: {
        feature: {
            saveAsImage: {}//将统计图保存为
        }
        ,right:100
        ,top:0
    },
    xAxis: {
        type: 'category',
        boundaryGap:false,
        data:['11.07','11.08','11.09','11.10','11.11','11.12','11.13','11.14','11.15','11.16']
    },
    yAxis: {
        type: 'value'
        /*min:0,
         max:60,
         splitNumber:6*/
    },
    series: [
        {
            name:'浏览次数',
            type:'line',
            stack: '总量1',
            areaStyle: {normal: {}},
            data:['10','22','10','50','13','31','15','10','22','10'],
            itemStyle : {normal : {color:'#32A8FF'}}
        }
    ]
};
//为echarts对象加载数据
myChartLine.setOption(optionLine);
效果图
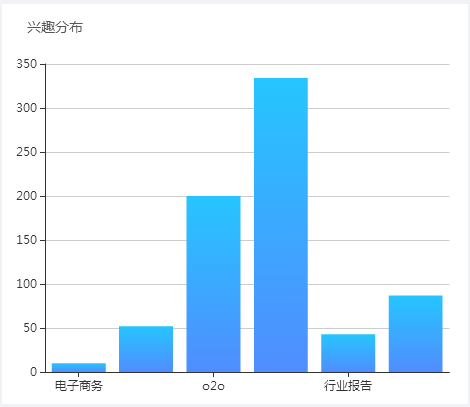
2.柱状图
var myChartBar = echarts.init(document.getElementById('chart2'));
optionBar = {
    title: {
        x:"left",
        text: '兴趣分布',
        textStyle:{
            fontSize:14
            ,fontWeight:'normal'
            ,color:'#565656'
        }
        ,left:20
        ,top:10
    },
    color: ['#32A8FF'],
    tooltip : {
        trigger: 'axis',
        axisPointer : {            // 坐标轴指示器,坐标轴触发有效
            type : 'shadow'        // 默认为直线,可选为:'line' | 'shadow'
        }
    },
    grid: {
        left: '3%',
        right: '4%',
        bottom: '3%',
        containLabel: true
    },
    xAxis : [
        {
            type : 'category',
            data : ['电子商务', '消费升级', 'o2o', '网络营销策略方案','行业报告','化妆品'],
            axisTick: {
                alignWithLabel: true
            }
        }
    ],
    yAxis : [
        {
            type : 'value'
        }
    ],
    series : [
        {
            name:'浏览',
            type:'bar',
            itemStyle:{
                normal:{
//颜色渐变函数 前四个参数分别表示四个位置依次为左、下、右、上
                    color: new echarts.graphic.LinearGradient(0, 1, 0, 0, [{
                        offset: 0,
                        color: '#508DFF'
                    }, {
                        offset: 1,
                        color: '#26C5FE'
                    }])

                }
            },
            data:[10, 52, 200, 334,43,87]
        }
    ]
};
//为echarts对象加载数据
myChartBar.setOption(optionBar);

效果图:
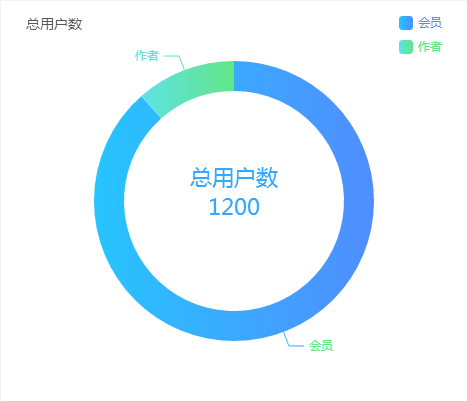
3.饼状图
var myChartPie = echarts.init(document.getElementById('chart3'));
optionPie = {
    title: {
        x:"left",
        text: '总用户数',
        textStyle:{
            fontSize:14
            ,fontWeight:'normal'
            ,color:'#565656'
        }
        ,left:20
        ,top:10
    },
    tooltip: {
        trigger: 'item',
        formatter: "{a} <br/>{b}: {c} ({d}%)"
    },
    legend: {
        data:['会员','作者'],
        color:['#32A8FF',' #02C800'],
        orient:'vertical'
        ,right:20
        ,top:10
        ,textStyle:{
            color:['#32A8FF',' #02C800']
        }
        ,itemWidth:14
    },
    series: [
        {
            name:'用户总数1200',
            type:'pie',
            radius:['55%','70%'],
            avoidLabelOverlap:false,
            color:['#32A8FF',' #02C800'],
            data:[{value:43535,name:'会员',itemStyle:{
                normal:{
                    color: new echarts.graphic.LinearGradient(1, 0, 0, 0, [{ //颜色渐变函数 前四个参数分别表示四个位置依次为左、下、右、上
                        offset: 0,
                        color: '#508DFF'
                    }, {
                        offset: 1,
                        color: '#26C5FE'
                    }])
                }
            }},{value:5667,name:'作者',itemStyle:{
                normal:{
                    color: new echarts.graphic.LinearGradient(1, 0, 0, 0, [{ //颜色渐变函数 前四个参数分别表示四个位置依次为左、下、右、上
                        offset: 0,
                        color: '#63E587'
                    }, {
                        offset: 1,
                        color: '#5FE2E4'
                    }])
                }
            }}]
        }
    ]
};
//为echarts对象加载数据
myChartPie.setOption(optionPie);

效果图:
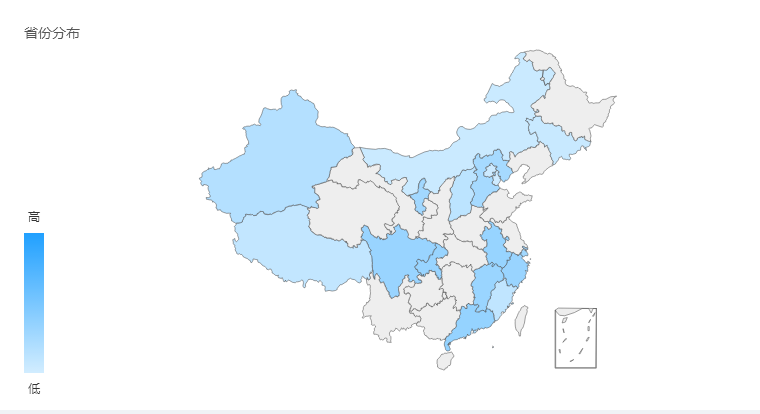
4.地图
var myChartMap = echarts.init(document.getElementById('chart4'));
function randomData() {
    return Math.round(Math.random()*1000);
}
optionMap = {
    title: {
        x:"left",
        text: '省份分布',
        textStyle:{
            fontSize:14
            ,fontWeight:'normal'
            ,color:'#565656'
        }
        ,left:20
        ,top:10
    },
    tooltip: {
        trigger: 'item'
        ,formatter:'{b}<br>浏览量:{c}'
    },

    visualMap: {
        min: 0,
        max: 2500,
        left:20,
        bottom:10,
        text: ['高','低'],// 文本,默认为数值文本
        color:['#20a0ff','#D2EDFF'],
        calculable: false
    },
    series: [
        {
            type: 'map',
            mapType: 'china',
            roam: false,
            data:[
                {name: '北京',value: randomData() },
                {name: '天津',value: randomData() },
                {name: '上海',value: randomData() },
                {name: '重庆',value: randomData() },
                {name: '河北',value: randomData() },
                {name: '安徽',value: randomData() },
                {name: '新疆',value: randomData() },
                {name: '浙江',value: randomData() },
                {name: '江西',value: randomData() },
                {name: '山西',value: randomData() },
                {name: '内蒙古',value: randomData() },
                {name: '吉林',value: randomData() },
                {name: '福建',value: randomData() },
                {name: '广东',value: randomData() },
                {name: '西藏',value: randomData() },
                {name: '四川',value: randomData() },
                {name: '宁夏',value: randomData() },
                {name: '香港',value: randomData() },
                {name: '澳门',value: randomData() }
            ]
        }
    ]
};
//为echarts对象加载数据
myChartMap.setOption(optionMap);

效果图:


 被折叠的 条评论
为什么被折叠?
被折叠的 条评论
为什么被折叠?
 到【灌水乐园】发言


