


 本文详细解读了JMeter聚合报告的各项指标,包括请求名称、样本数、平均响应时间、中位数、百分位数、最小及最大响应时间、错误率、吞吐量以及收发数据速率,帮助读者深入理解性能测试结果。
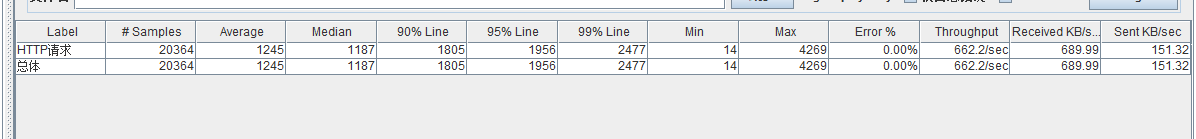
当我们压力测试完后,最关心就是结果数据了,下面一起来分析Jmeter聚合报告数据。
首先来看下Jmeter的help是如何解释这些含义的。
1、Label - The label of the sample. If "Include group name in label?" is selected, then the name of the thread group is added as a prefix. This allows identical labels from different thread groups to be collated separately if required.
2、 Samples - The number of samples with the same label
3、Average - The average time of a set of results
4、Median - The median is the time in the middle of a set of results. 50% of the samples took no more than this time; the remainder took at least as long。
5、90% Line - 90% of the samples took no more than this time. The remaining samples took at least as long as this. (90th percentile)
6、95% Line - 95% of the samples took no more than this time. The remaining samples took at least as long as this. (95th percentile)
7、99% Line - 99% of the samples took no more than this time. The remaining samples took at least as long as this. (99th percentile)
8、Min - The shortest time for the samples with the same label
9、Max - The longest time for the samples with the same label
10、Error % - Percent of requests with errors
11、Throughput - the Throughput is measured in requests per second/minute/hour. The time unit is chosen so that the displayed rate is at least 1.0. When the throughput is saved to a CSV file, it is expressed in requests/second, i.e. 30.0 requests/minute is saved as 0.5.
12、Received KB/sec - The throughput measured in received Kilobytes per second
13、Sent KB/sec - The throughput measured in sent Kilobytes per second
我用百度翻译了一下,大致意思如下:
1、Label - 请求对应的name属性值。
2、 Samples - 具有相同标号的样本数,总的发出请求数。
3、Average - 请求的平均响应时间。
4、Median - 50%的样本都没有超过这个时间。这个值是指把所有数据按由小到大将其排列,就是排列在第50%的值。
5、90% Line - 90%的样本都没有超过这个时间。这个值是指把所有数据按由小到大将其排列,就是排列在第90%的值。
6、95% Line - 95%的样本都没有超过这个时间。这个值是指把所有数据按由小到大将其排列,就是排列在第95%的值。
7、99% Line - 99%的样本都没有超过这个时间。这个值是指把所有数据按由小到大将其排列,就是排列在第99%的值。
8、Min - 最小响应时间。
9、Max - 最大响应时间。
10、Error % - 本次测试中,有错误请求的百分比。
11、Throughput - 吞吐量是以每秒/分钟/小时的请求量来度量的。这里表示每秒完成的请求数。
12、Received KB/sec - 收到的千字节每秒的吞吐量测试。
13、Sent KB/sec - 发送的千字节每秒的吞吐量测试。


 262
262

 被折叠的 条评论
为什么被折叠?
被折叠的 条评论
为什么被折叠?
 到【灌水乐园】发言


