


 本文介绍了如何使用Silverlight工具箱中的图表控件绘制柱状图、线形图和饼状图,并提供了绑定数据的具体示例。
Silverlight工具箱给我们提供了一个数据统计表控件。我们只需要将数据与这套工具结合起来,就可以绘制出柱形,线性,饼状图形等。
我们在绘制图表之前,需要引用类库程序集。如果我们将控件拖到视图当中,IDE就会自动引入程序集文件并创建命名空间。
每一个图表必须在Chart对象的Chart.Series属性标记内进行定义,每个Series可以包含若干个同种类型的图表,这样我们就可以在一个图表中实现多种数据的比较了。
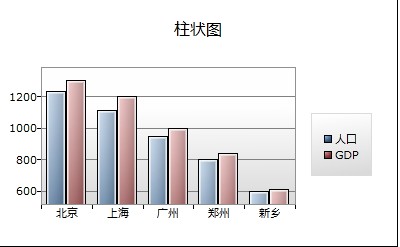
下面是绘制柱状图形的代码:
<toolkit:Chart x:Name="chartColumn" Margin="5" Title="柱状图" Width="400" Height="250">
<toolkit:Chart.Series>
<toolkit:ColumnSeries Title="人口"
DependentValueBinding="{Binding Value}"
IndependentValueBinding="{Binding Key}"/>
<toolkit:ColumnSeries Title="GDP"
DependentValueBinding="{Binding Value}"
IndependentValueBinding="{Binding Key}"/>
</toolkit:Chart.Series>
</toolkit:Chart>
然后我们来绑定数据。
((ColumnSeries)chartColumn.Series[0]).ItemsSource = new KeyValuePair<string, int>[]
{
new KeyValuePair<string,int>("北京",1230),
new KeyValuePair<string,int>("上海",1110),
new KeyValuePair<string,int>("广州",950),
new KeyValuePair<string,int>("郑州",800),
new KeyValuePair<string,int>("新乡",600)
};
((ColumnSeries)chartColumn.Series[1]).ItemsSource = new KeyValuePair<string, int>[]
{
new KeyValuePair<string,int>("北京",1300),
new KeyValuePair<string,int>("上海",1200),
new KeyValuePair<string,int>("广州",1000),
new KeyValuePair<string,int>("郑州",840),
new KeyValuePair<string,int>("新乡",610)
};
第一个用于绑定人口数据,第二个用于绑定GDP数据。我们创建键值对KeyValuePair数组作为图表的数据源。Value表示城市名,Key表示人口或GDP,这两个属性分别是对DependentValueBinding和IndependentValueBinding进行绑定。
效果如图:
如果我们使用线形或者点行,那么我们X轴上必须是数值型,一旦我们设定为String类型,就会发生程序异常。
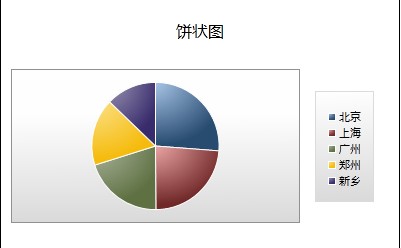
下面我们来绘制饼状图,代码如下:
<toolkit:Chart x:Name="chartPie" Margin="5" Title="饼状图" Width="400" Height="250">
<toolkit:Chart.Series>
<toolkit:PieSeries Title="人口"
DependentValueBinding="{Binding Value}"
IndependentValueBinding="{Binding Key}"/>
</toolkit:Chart.Series>
</toolkit:Chart>
绑定数据代码:
((PieSeries)chartPie.Series[0]).ItemsSource = new KeyValuePair<string, int>[]
{
new KeyValuePair<string,int>("北京",1230),
new KeyValuePair<string,int>("上海",1110),
new KeyValuePair<string,int>("广州",950),
new KeyValuePair<string,int>("郑州",800),
new KeyValuePair<string,int>("新乡",600)
};
效果如图:


 1
1

 被折叠的 条评论
为什么被折叠?
被折叠的 条评论
为什么被折叠?
 到【灌水乐园】发言


