


 本文详细介绍了如何在Vue项目中集成Highcharts图表库,并通过一个具体示例展示了配置过程及图表展示方法。
首先安装依赖
npm install -S vue-highcharts
在main.js 中进行配置
import Vue from 'vue'
import App from './App'
import router from './router'

//highcharts的引入
import VueHighcharts from 'vue-highcharts';

Vue.use(VueHighcharts)
Vue.config.productionTip = false

new Vue({
  el: '#app',
  router,
  template: '<App/>',
  components: { App },
  methods:{

  	moreChart() {
        var options = this.getMoreOptions(this.type);

        if (this.chart) {
            this.chart.destroy();
        };
    // 初始化 Highcharts 图表
    this.chart = new Highcharts.Chart('highcharts-more', options);
    }
  }
})
新建一个作为comp.vue图表的组件
<template>
	<div class="x-bar">
		<div :id="id" :option="option"></div>
	</div>
</template>
<script>
	import HighCharts from 'highcharts'
	export default {
		// 验证类型
		props: {
			id: {
				type: String
			},
			option: {
				type: Object
			}
		},
		mounted() {
			HighCharts.chart(this.id, this.option)
		}
	}
</script>
在需要使用的页面调用组件
<template>
<div class="hello">
<div class="charts">
<x-chart :id="id" :option="option"></x-chart>
</div>
</div>
</template>
<script>
// 导入chart组件
import XChart from './comp.vue'
export default {
data() {
return {
id: 'test',
option: {
chart: {
type: 'line'
},
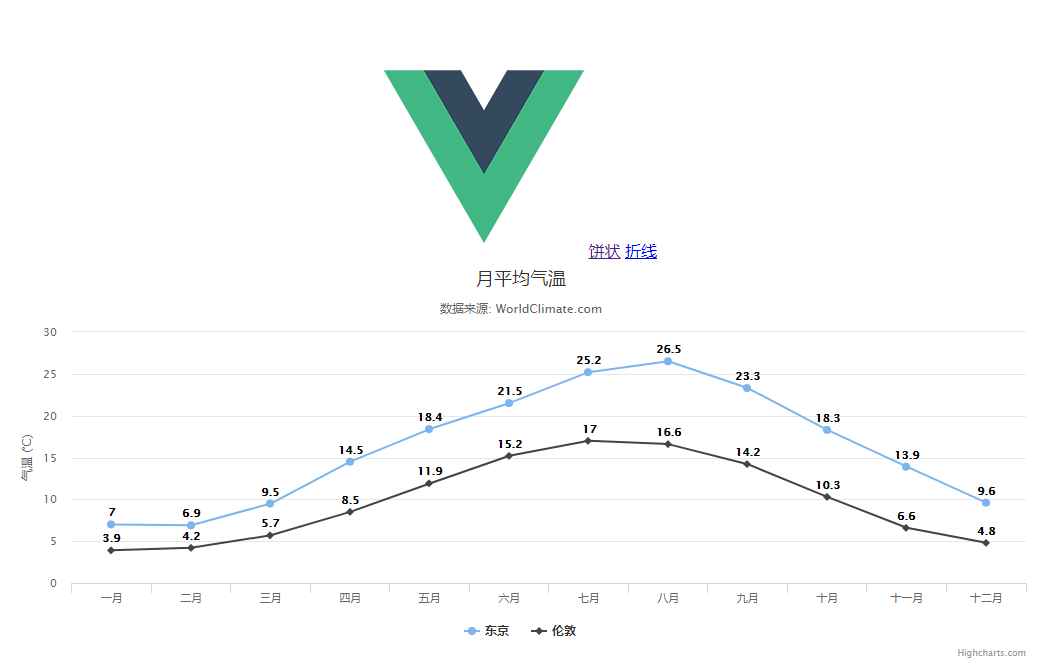
title: {
text: '月平均气温'//表头文字
},
subtitle: {
text: '数据来源: WorldClimate.com'//表头下文字
},
xAxis: {//x轴显示的内容
categories: ['一月', '二月', '三月', '四月', '五月', '六月', '七月', '八月', '九月', '十月', '十一月', '十二月'],
plotbands:[{//可以显示一个方块,如果需要的话可以更改透明度和颜色
from:4.5,
to:6.5,
color:''rgba(68,170,213,0)//透明度和颜色
}]
},
yAxis: {//y轴显示的内容
title: {
text: '气温 (°C)'
}
},
plotOptions: {
line: {
dataLabels: {
enabled: true // 开启数据标签
},
enableMouseTracking: false // 关闭鼠标跟踪,对应的提示框、点击事件会失效
}
},
series: [{//两条数据
name: '东京',
data: [7.0, 6.9, 9.5, 14.5, 18.4, 21.5, 25.2, 26.5, 23.3, 18.3, 13.9, 9.6]
}, {
name: '伦敦',
data: [3.9, 4.2, 5.7, 8.5, 11.9, 15.2, 17.0, 16.6, 14.2, 10.3, 6.6, 4.8]
}]
}
}
},
components: {
XChart
}
}
</script>
就是这个样子啦,
如果想要使用highcharts的其他图表,
只要对应将对应的数据vue的放在data(){} 里面就可以了
补充:
tickInterval 用来改变行间距,
labels 用来改变数值及数值单位,
yAxis: {
                        tickInterval:2,//y轴间距
                        title: {
                            text: '水果 单位'
                        },
                        labels: { //y轴数值改变
                            formatter: function() {
                                return this.value / 10 + 'k';
                            }
                        }
                    },


 1305
1305

 被折叠的 条评论
为什么被折叠?
被折叠的 条评论
为什么被折叠?
 到【灌水乐园】发言


