


需求一到,要折腾趋势图。
打开RDLC一看,发现有折线图,曲线图,可用。
说一下折腾RDLC的简单步骤:
一:前台页面折腾控件
1.新建项目->DataSet数据集->新建DataTable,把要显示的字段先设计好
2.新建报表RDLC->选择工具箱->拖出图表到报表设计界面上。
3.右键图表属性->数据->数据集名称->选择刚才的表。
4.对着图表右键->图型类型->折线图
5.选择中图表->出现上右下三个数据框->将字段分别往里拖(上面为值字段[如数据值];右边为序列字段[如分类];下面为类别[如日期])
6.将上面的值右键属性->把=Count(Fields!GatherValue.Value) 改成=Sum(Fields!GatherValue.Value) 不改就显示不出来了
7.页面里拖出一个ReportViewer:
<rsweb:ReportViewer ID="reportViewer" runat="server" DocumentMapCollapsed="True" Font-Names="Verdana" Font-Size="8pt"
Height="100%" ShowBackButton="True" Width="99%">
</rsweb:ReportViewer>
Height="100%" ShowBackButton="True" Width="99%">
</rsweb:ReportViewer>
二:后台折腾代码,就几行。

 代码
代码
protected void Page_Load(object sender, EventArgs e)
{
DataTable dt = ExeCustomSQL(Module.RUnit.RunitCustomSQL.RUnitTrend);
dt.TableName = "RUnitTrend";//表名
//绑定RDLC报表
BindRDLCReport(dt);
}
private void BindRDLCReport(DataTable dt)
{
reportViewer.ProcessingMode = ProcessingMode.Local;
LocalReport localReport = reportViewer.LocalReport;
localReport.ReportPath = "App_Data/RUnitTrend.rdlc";//报表路径
ReportDataSource dsSalesOrder = new ReportDataSource();
dsSalesOrder.Name = "Tables_RUnitTrend";//DataSet名_表名
dsSalesOrder.Value = dt;
localReport.DataSources.Add(dsSalesOrder);
}
{
DataTable dt = ExeCustomSQL(Module.RUnit.RunitCustomSQL.RUnitTrend);
dt.TableName = "RUnitTrend";//表名
//绑定RDLC报表
BindRDLCReport(dt);
}
private void BindRDLCReport(DataTable dt)
{
reportViewer.ProcessingMode = ProcessingMode.Local;
LocalReport localReport = reportViewer.LocalReport;
localReport.ReportPath = "App_Data/RUnitTrend.rdlc";//报表路径
ReportDataSource dsSalesOrder = new ReportDataSource();
dsSalesOrder.Name = "Tables_RUnitTrend";//DataSet名_表名
dsSalesOrder.Value = dt;
localReport.DataSources.Add(dsSalesOrder);
}
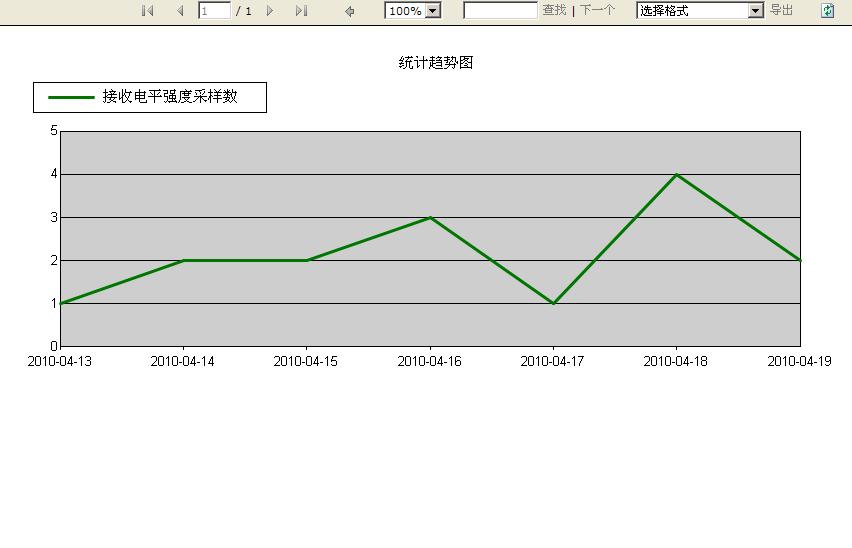
到此保存运行。效果如下图:


 4177
4177

 被折叠的 条评论
为什么被折叠?
被折叠的 条评论
为什么被折叠?
 到【灌水乐园】发言


