


 本文介绍了一种调试PowerSI程序崩溃的有效方法。当PowerSI因错误代码启动失败时,通过调整Windows的问题报告设置,可以在程序崩溃时启用调试选项。此外,还介绍了如何使用__debugbreak()和DebugBreak()在特定位置打断点。
Let’s assume there is buggy code in PowerSI.
BOOL CTDXFApp::InitInstance()
{
double dVal=((_complex*)0)->x;
……
}
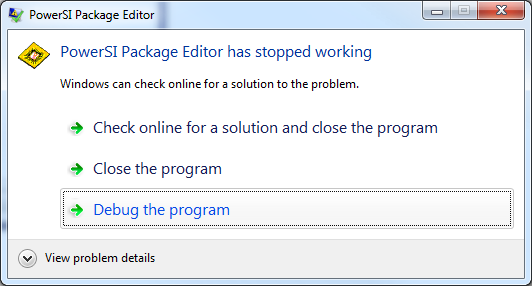
PowerSI crash when it is launched. Then we will see
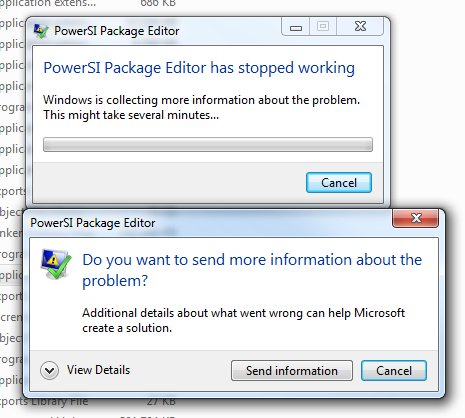
There is no button for us to debug the crash. (Note: It is too late to attach PowerSI in VS. If we do this, we can see callstack only, but no more)
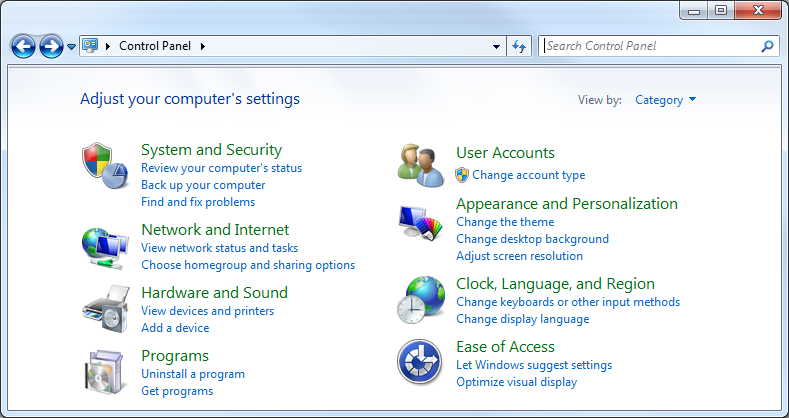
I find a way to change this. We need to change Windows setup. The steps are
1) Open Control panel
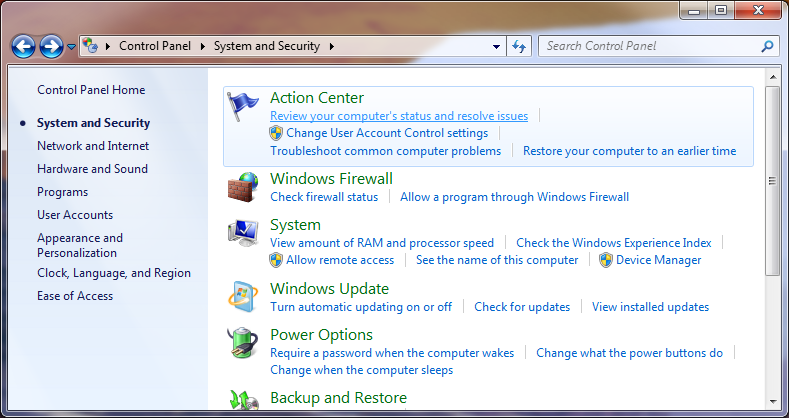
2) Find
Action Center
3)
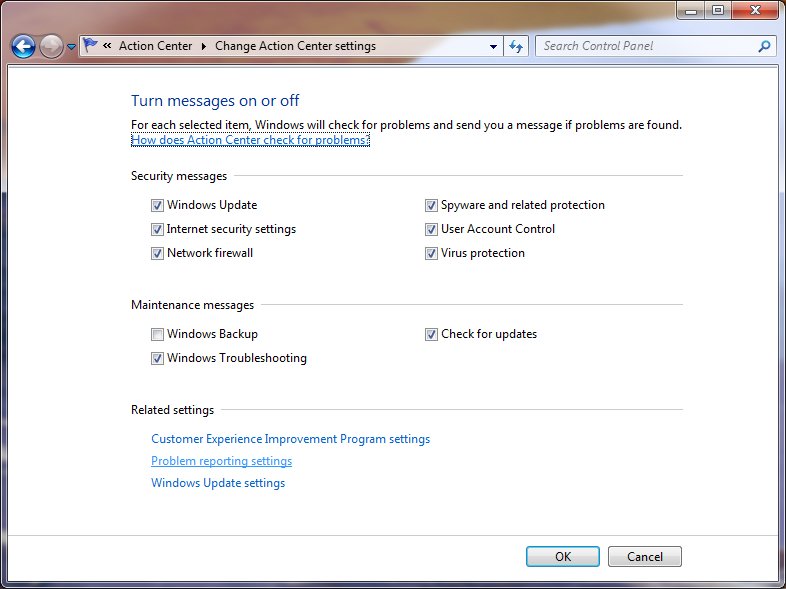
Find Action Center settings
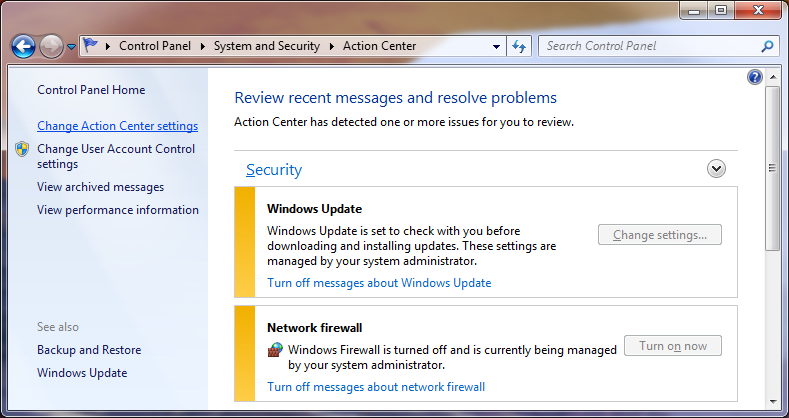
4) Find
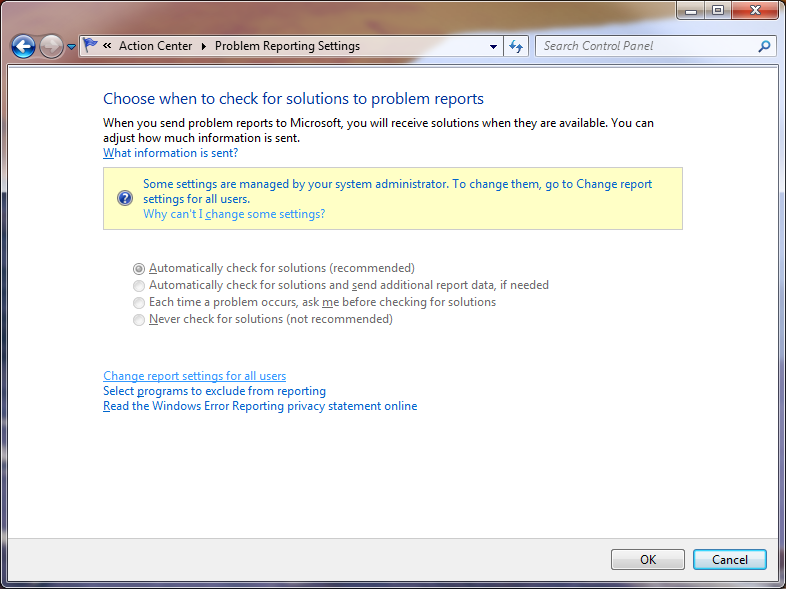
problem reporting settings
5) Click
Change report settings for all users
6) Select
Each time……
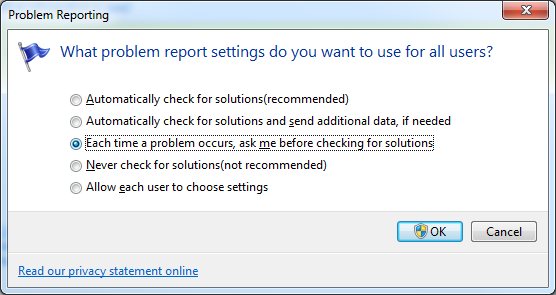
All set.
Let’s run PowerSI again, then it crash. Now we can start VS to debug the crash by selecting the debug option.

The way is very helpful when we debug the child process or a dll. We can put a “break” code where we want to stop. There are two options about “break” code.
1) Use __debugbreak(). It is from CRT.
2) Use DebugBreak(). It is from WIN32.


 被折叠的 条评论
为什么被折叠?
被折叠的 条评论
为什么被折叠?
 到【灌水乐园】发言


