


 本文介绍了一种在使用Matplotlib绘图时隐藏X轴的方法。通过设置plt.tick_params函数中的参数,可以实现X轴刻度及标签的隐藏。此技巧适用于希望简化图表展示场景。
组内有个同事,有个奇怪的需求需要matplotlib删除x轴
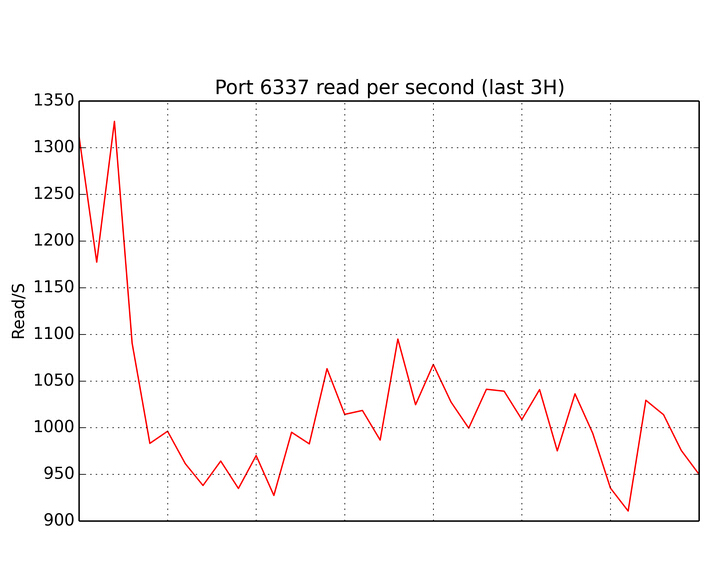
效果图如下:
关键代码:
from matplotlib import pyplot as plt
plt.plot(range(10))
plt.tick_params(\
    axis='x',          # changes apply to the x-axis
    which='both',      # both major and minor ticks are affected
    bottom='off',      # ticks along the bottom edge are off
    top='off',         # ticks along the top edge are off
    labelbottom='off') # labels along the bottom edge are off
plt.show()
plt.savefig('plot')
plt.clf()
参考资料:
http://stackoverflow.com/questions/12998430/remove-xticks-in-a-matplot-lib-plot


 512
512

 被折叠的 条评论
为什么被折叠?
被折叠的 条评论
为什么被折叠?
 到【灌水乐园】发言


