


 本文探讨了机器学习的基本概念,包括监督学习、无监督学习、半监督学习及强化学习等,并通过一个实际案例展示了如何使用线性回归模型预测国家的生活满意度。
<Hands-on ML with Sklearn & TF> Chapter 1
- what is ml
- from experience E with respect to some task T and some performance measure P, if its performance on T, as measured by P, improves with experience E.
- what problems to solve
- exist solution but a lot of hand-tuning/rules
- no good solutions using a traditional approach
- fluctuating environment
- get insight about conplex problem and large data
- type
- whether or not trained with human supervision(supervised, unsupervised, semisupervised, reinforcement)
- whether or not learn incrementally on the fly(online, batch)
- whether or not work by simply comparing new data point vs know data point,or instance detect pattern in training data and build a prediction model(instace-based, model-based)
- (un)supervision learning
- supervision : include the desired solution called labels
- classification,K-Nearest Neighbors, Linear Regression, Logistic Regression, SVM, Decision Trees, Random Forests, Neural network
- unsupervision : without labels
- Clustering : k-means, HCA, ecpectation maximization
- Viualization and dimensionality reducation : PCA, kernal PCA, LLE, t-SNE
- Association rule learning : Apriori, Eclat
- semisupervision
- unsupervision --> supervision
- reinforcement : an agent in context
- observe the environment
- select and perform action
- get rewards in return
- supervision : include the desired solution called labels
- batch/online learning
- batch : offline, to known new data need to train a new version from scratch one the full dataset
- online : incremental learning : challenge is bad data
- instance-based/model-based
- instance-based : the system learns the examples by heart, then the generalizes to the new cases using a similarity measure
- model-based : studied the data; select a model; train it on the training data; applied the model to make predictions on new cases
- Challenge
- insufficient quantity of training data
- nonrepresentative training data
- poor-quality data
- irrelevant features : feature selection; feature extraction; creating new feature by gathering new data
- overfitting : regularization -> hyperparameter
- underfitting : powerful model; better feature; reduce construct
- Testing and Validating
- 80% of data for training 20% for testing
- validating : best model and hyperparameter for training set unliking perform as well on new data
- train multiple models with various hyperparameters using training data
- to get generatlization error , select the model and hyperparamaters that perform best on the validation set
- cross-validating : the training set is split into complementary subsets, ans each model is trained against a different conbination of thse subsets and validated against the remain parts.
Example 1-1:
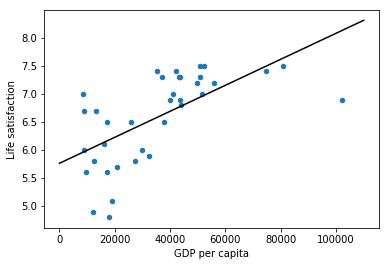
import matplotlib
import matplotlib.pyplot as plt
import numpy as np
import pandas as pd
import sklearn.linear_model

#load the data
oecd_bli = pd.read_csv("datasets/lifesat/oecd_bli_2015.csv",thousands=',')
gdp_per_capita = pd.read_csv("datasets/lifesat/gdp_per_capita.csv",thousands=',',delimiter='\t',encoding='latin1',na_values='n/a')

#prepare the data
def prepare_country_stats(oecd_bli, gdp_per_capita):
    #get the pandas dataframe of GDP per capita and Life satisfaction
    oecd_bli = oecd_bli[oecd_bli["INEQUALITY"]=="TOT"]
    oecd_bli = oecd_bli.pivot(index="Country", columns="Indicator", values="Value")
    gdp_per_capita.rename(columns={"2015": "GDP per capita"}, inplace=True)
    gdp_per_capita.set_index("Country", inplace=True)
    full_country_stats = pd.merge(left=oecd_bli, right=gdp_per_capita, left_index=True, right_index=True)
    return full_country_stats[["GDP per capita", 'Life satisfaction']]

country_stats = prepare_country_stats(oecd_bli, gdp_per_capita)
#regularization remove_indices = [0, 1, 6, 8, 33, 34, 35]
country_stats.to_csv('country_stats.csv',encoding='utf-8')
X = np.c_[country_stats["GDP per capita"]]
Y = np.c_[country_stats["Life satisfaction"]]

#Visualize the data
country_stats.plot(kind='scatter',x='GDP per capita',y='Life satisfaction')

#Select a linear model
lin_reg_model = sklearn.linear_model.LinearRegression()

#Train the model
lin_reg_model.fit(X, Y)

#plot Regression model
t0, t1 = lin_reg_model.intercept_[0], lin_reg_model.coef_[0][0]
X = np.linspace(0, 110000, 1000)
plt.plot(X, t0 + t1 * X, "k")
plt.show()

#Make a prediction for Cyprus
X_new=[[22587]]
print(lin_reg_model.predict(X_new))
课后练习挺好的


 被折叠的 条评论
为什么被折叠?
被折叠的 条评论
为什么被折叠?
 到【灌水乐园】发言


