#!/usr/bin/env python3
# -*- coding: utf-8 -*-
"""
Created on Thu Jan 31 18:30:41 2019
@author: lg
"""
import tushare as ts
#获取连接备用
cons = ts.get_apis()
ts.set_token('luoganttcc46fcca1e059c38cde5f56fe7748f53c274036cb8cf0c061c2056a690')
pro = ts.pro_api()
from matplotlib import pyplot as plt
import matplotlib.dates as mdate
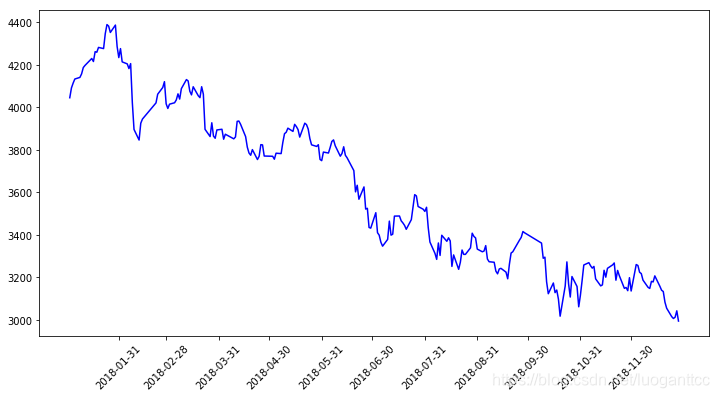
df = ts.bar('000300', conn=cons, asset='INDEX', start_date='2018-01-01', end_date='2018-12-31')
df=df.sort_index()
import pandas as pd
#生成figure对象
fig = plt.figure(figsize=(12,6))
#生成axis对象
#plt.figure(figsize=(8,6))
ax = fig.add_subplot(111) #本案例的figure中只包含一个图表
#设置x轴为时间格式,这句非常重要,否则x轴显示的将是类似于‘736268’这样的转码后的数字格式
ax.xaxis.set_major_formatter(mdate.DateFormatter('%Y-%m-%d'))
#设置x轴坐标值和标签旋转45°的显示方式
plt.xticks(pd.date_range(df.index[0],df.index[-1],freq='M'),rotation=45)
#x轴为table.index,也就是‘受理日期’,y轴为数量,颜色设置为红色
ax.plot(df.index,df['open'],color='b')
plt.show()


 被折叠的 条评论
为什么被折叠?
被折叠的 条评论
为什么被折叠?
 到【灌水乐园】发言


