


 本文档详细介绍了如何使用jQuery的Flot插件创建交互式图形。Flot是一个纯JavaScript库,用于在网页上绘制漂亮且可定制的图表。教程中展示了如何配置线条图和条形图,包括数据系列、颜色、点的样式和图表的网格设置等,以实现动态和响应式的图表效果。
 在本教程中,我们将编写一个交互式图形使用jQuery和CSS3。我们将使用jQuery的流行的绘图插件“Flot”。Flot是一个纯粹的
JavaScript,jQuery的绘图库。这个插件很简单,但强大到足以创造出一些漂亮的和交互式图表。 HTML MARKUP
jQuery and Flot Plugin
$(document).ready(function () {
// Graph scripts here
});
Graph Data
var graphData = [{
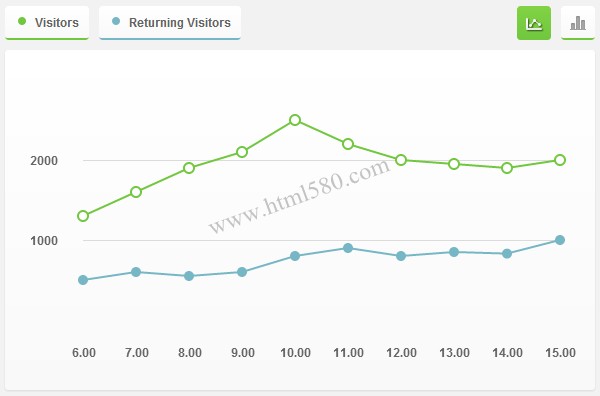
// Visits
data: [ [6, 1300], [7, 1600], [8, 1900], [9, 2100], [10, 2500], [11, 2200], [12, 2000], [13, 1950], [14, 1900], [15, 2000] ],
color: '#71c73e'
}, {
// Returning Visits
data: [ [6, 500], [7, 600], [8, 550], [9, 600], [10, 800], [11, 900], [12, 800], [13, 850], [14, 830], [15, 1000] ],
color: '#77b7c5',
points: { radius: 4, fillColor: '#77b7c5' }
}
];
Load Graphs
// Lines
$.plot($('#graph-lines'), graphData, {
series: {
points: {
show: true,
radius: 5
},
lines: {
show: true
},
shadowSize: 0
},
grid: {
color: '#646464',
borderColor: 'transparent',
borderWidth: 20,
hoverable: true
},
xaxis: {
tickColor: 'transparent',
tickDecimals: 2
},
yaxis: {
tickSize: 1000
}
});
// Bars
$.plot($('#graph-bars'), graphData, {
series: {
bars: {
show: true,
barWidth: .9,
align: 'center'
},
shadowSize: 0
},
grid: {
color: '#646464',
borderColor: 'transparent',
borderWidth: 20,
hoverable: true
},
xaxis: {
tickColor: 'transparent',
tickDecimals: 2
},
yaxis: {
tickSize: 1000
}
});
Graph Container Styles
/* Resets */
.graph-container,
.graph-container div,
.graph-container a,
.graph-container span {
margin: 0;
padding: 0;
}
/* Gradinet and Rounded Corners */
.graph-container, #tooltip, .graph-info a {
background: #ffffff;
background: -moz-linear-gradient(top, #ffffff 0%, #f9f9f9 100%);
background: -webkit-gradient(linear, left top, left bottom, color-stop(0%,#ffffff), color-stop(100%,#f9f9f9));
background: -webkit-linear-gradient(top, #ffffff 0%,#f9f9f9 100%);
background: -o-linear-gradient(top, #ffffff 0%,#f9f9f9 100%);
background: -ms-linear-gradient(top, #ffffff 0%,#f9f9f9 100%);
background: linear-gradient(to bottom, #ffffff 0%,#f9f9f9 100%);
-webkit-border-radius: 3px;
-moz-border-radius: 3px;
border-radius: 3px;
}
/* Graph Container */
.graph-container {
position: relative;
width: 550px;
height: 300px;
padding: 20px;
-webkit-box-shadow: 0px 1px 2px rgba(0,0,0,.1);
-moz-box-shadow: 0px 1px 2px rgba(0,0,0,.1);
box-shadow: 0px 1px 2px rgba(0,0,0,.1);
}
.graph-container > div {
position: absolute;
width: inherit;
height: inherit;
top: 10px;
left: 25px;
}
.graph-info {
width: 590px;
margin-bottom: 10px;
}
相关链接


 1039
1039

 被折叠的 条评论
为什么被折叠?
被折叠的 条评论
为什么被折叠?
 到【灌水乐园】发言


