


 本文档介绍如何结合Microsoft Silverlight和JavaScript创建一个实时的AJAX线图。通过示例代码和实际演示,展示了如何利用WPFGraph.js脚本与Silverlight共同绘制定制的线图,同时提供了服务器端的AJAX实现和客户端的HTML、JavaScript代码。文章还讨论了如何通过修改XAML来调整图表的外观。
Introduction
This article is about creating a real time AJAX based line graph, using Microsoft Silverlight and JavaScript.
If you are impatient to see how it really looks, visit my website to see a 'JavaScript-only' demo. Download the source code and run it to see the actual thing in action. In this article, I will explain how to use my WPFGraph.js script along with Silverlightto create custom line graphs.
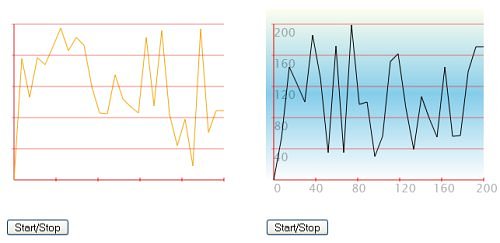
Images of the line graph in action with two different skins
Writing the XAML
This is the only important part. First, I will explain the bare minimum XAML which my script expects. As show below the graph is actually made of multiple line segments.
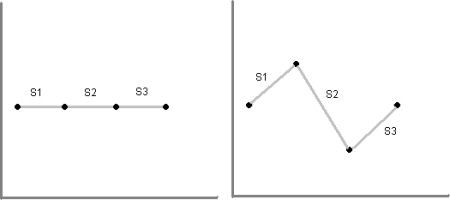
Figure showing line segments used for drawing the graph
XML
Copy Code
...
...
If you want to plot 10 points then you need to have 11 segments. In that case your segments should be named 'gline0, gline1....gline10'. Note that the name 'gline' is hardcoded into the JavaScript. If you decide to change it to something else don't forget to modify the WPFGraph.js file. Apart from this section, we have markup to create the Xand Yaxis and markers on axis. This can be customized as per your need.
XML
Copy Code
Server side code for AJAX
In this example, I have used a simple function (Webmethod) in ASP.NET to do the job. It returns a numeric value. In the real world scenario, this would come from a database or some other source. I have also placed a random delay to simulate real world conditions. This method should be in code-behind file of page where we want to place the graph. It can be invoked from client side JavaScript using PageMethods object.
C#
Copy Code
[System.Web.Services.WebMethod]
public static int GetNextValue()
{
Random r = new Random();
System.Threading.Thread.Sleep(r.Next(100, 500));
return r.Next(0, 190);
}
Client side HTML and JavaScript
On the *.aspx page, you need to add the following markup to create an instance of the Silverlightcontrol.
ASP.NET
Copy Code
Notice that there is a ScriptManager control on the ASP.NET page with it's EnablePageMethods property set to true. Also I have put a button which can be used to start and stop real time plotting on the graph.
The next important part is writing the JavaScript.
JavaScript
Copy Code
var mygraph;
var start =true;
function OnCanvasLoaded(sender,args)
{
mygraph = new WPFGraph("slvr1",26,200);
PageMethods.GetNextValue(OnComplete,null);
}
function OnComplete(a)
{
mygraph.PlotValue(a);
if(start ==false)return;
window.setTimeout("PageMethods.GetNextValue(OnComplete,null)",500);
}
function startstop()
{
start=!start;
if(start)PageMethods.GetNextValue(OnComplete,null);
}
The first thing to note here is the parameters to the constructor of WPFGraphclass. The first is the id of the Silverlightcontrol, the second is the number of points to be plotted(= no of segments -1) and the last parameter is the maximum value the graph will be used to plot (range). The second parameter relates to the XAML file while the third is related to values coming from the server side function. You should set them appropriately in your code.
Further customization
There are lot of interesting things that you can do with XAML to alter the appearance of the graph. In Example2.aspx, I have created the same graph using different XAML. You will find it in the downloaded source. Hope you find my code useful. If you do happen to use it in your application, I would be happy to hear from you !


 被折叠的 条评论
为什么被折叠?
被折叠的 条评论
为什么被折叠?
 到【灌水乐园】发言


