


 本文介绍在 Azure Kubernetes Service (AKS) 上安全部署 Apache Kafka 的方法,并详细讲解了如何通过 Azure Monitor 监控 Kafka 集群的状态。
Calling it Part2, but this is indeed the third post in our series of running Kafka on AKS, or any flavor of Kubernetes:
称之为Part2,但这确实是我们在AKS或任何风味的Kubernetes上运行Kafka的系列文章中的第三篇:
Blog Post One— Running Kafka on Kubernetes
博客文章一—在Kubernetes上运行Kafka
Blog Post Two— Monitoring Kafka via Prometheus & Grafana.
博客文章二-通过Prometheus和Grafana监视Kafka 。
The rationale behind calling it Part 2 is that you would only need the context & concepts of the first one, where we deployed a basic Kafka Cluster on AKS, created some Topics & Users and test the setup with Producer & Consumer CLI commands. Building on those, this blog post would focus on:
之所以称其为第2部分,是因为您只需要第一个部分的上下文和概念,我们在AKS上部署了一个基本的Kafka集群,创建了一些Topics&Users,并使用Producer和Consumer CLI命令测试了设置。 在此基础上,本博客文章将重点关注:
- Exposing the brokers outside Kubernetes Cluster securely. 在Kubernetes Cluster之外安全地暴露代理。
- Exposing Prometheus Metrics & Consuming them via Azure Monitor 公开Prometheus指标并通过Azure Monitor进行使用
Like before, we do most of our Kafka related setup using the Strimzi Operator for Kafka (version 0.19 at the time of this writing) and deploy Kafka to Azure Kubernetes Service, but you can deploy to any flavor of Kubernetes. Let’s get started !
和以前一样,我们使用Strimzi Operator for Kafka (在撰写本文时为0.19版本)完成与Kafka有关的大多数设置,并将Kafka部署到Azure Kubernetes Service,但是您可以部署到任何类型的Kubernetes。 让我们开始吧 !
将Kafka安全暴露在K8s集群外 (Expose Kafka outside K8s Cluster Securely)
As you tend to expose the Kafka brokers outside the cluster, you must do so securely & to that end you should consider:
由于您倾向于将Kafka经纪人暴露在集群之外,因此必须安全地这样做,为此,您应该考虑:
Enabling TLS encryption for data exchange
启用TLS加密进行数据交换
Authentication to provide Identity
身份验证以提供身份
Authorization to allow/decline actions to Users on Topics
授权允许/拒绝针对主题的用户操作
All these features are supported by Strimzi Operator out of the box, and all we need to do is to add the following snippets in the Kafka Custom Resource. But before we go there, lets have a look at Listeners !
所有这些功能均由Strimzi Operator支持,开箱即用,我们要做的就是在Kafka自定义资源中添加以下代码段。 但是在我们去那里之前,让我们看一下Listeners!
Kafka自定义资源的侦听器 (Listeners for Your Kafka Custom Resource)
Strimzi introduces the concept of a Listener for a Kafka Custom resource, using which you can specify how the client applications would interact with Kafka brokers. It supports following variations
Strimzi引入了Kafka自定义资源的Listener的概念,通过它可以指定客户端应用程序如何与Kafka代理进行交互。 它支持以下变化
plain — used to expose the brokers inside the cluster only. We used this in first blog of this series
普通-用于仅在集群内部公开代理。 我们在本系列的第一个博客中使用了它
external — Use this to expose the brokers outside the cluster. Depending on how your Kubernetes cluster is setup, it supports different values for
externallisteners:loadbalancerfor using LoadBalancer services when using a public cloud service for Kubernetes,routeto use Openshift Routes,nodeportif you want to expose & use ports on Kubernetes nodes itself (like in a bare-metal environment),ingressto use Kubernetes Ingress like Nginx Ingress or Traefik. In this blog post, we will try & use theloadbalanceroption for our exposing our brokersexternally!external(外部) —使用此选项可将代理公开到群集之外。 根据您的Kubernetes集群是如何设置,它支持不同的价值观
external听众:loadbalancer的使用Kubernetes,公共云服务时使用负载平衡器服务route使用Openshift路线,nodeport如果要公开和使用的端口上Kubernetes节点本身(如在裸金属环境中),ingress到使用Kubernetes入口像Nginx的入口或Traefik 。 在此博客文章中,我们将尝试使用loadbalancer选项在externally公开经纪人!tls — Use this for having a mutual TLS Authentication within the Kubernetes cluster.
TLS -使用此为Kubernetes集群内具有相互TLS认证。
For our use case, we configure the external listener type with type: loadbalancer value as follows in our Kafka CR
对于我们的用例,我们在Kafka CR中使用以下type: loadbalancer配置external侦听type: loadbalancer value
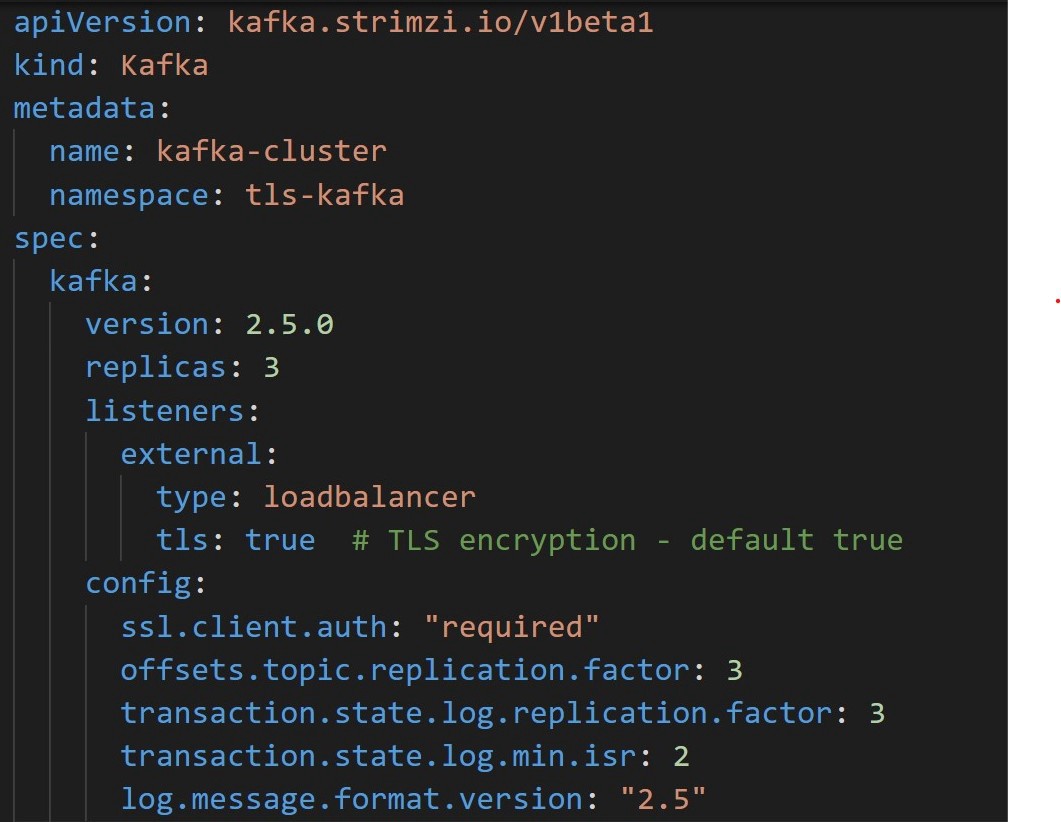
You can see the complete Kafka custom resource here. Let’s get started — Create a new namespace for your Kafka resources & create the Kafka cluster
您可以在此处查看完整的Kafka自定义资源。 让我们开始吧-为您的Kafka资源创建一个新的命名空间并创建Kafka集群
kubectl create namespace tls-kafka
kubectl apply -f https://raw.githubusercontent.com/agrajm/strimzi-kafka-aks/master/tls-setup-public-broker-ep/kafka-cluster.yaml
What this does to our AKS Cluster is that it creates
这对我们的AKS集群的作用是
StatefulSets&Podsfor Kafka Brokers & ZookeeperStatefulSets及Pods卡夫卡经纪及动物园管理员ConfigMapsto hold Kafka & Zookeeper configuration: kafka-cluster-kafka-config & kafka-cluster-zookeeper-config respectively.ConfigMaps保存Kafka和Zookeeper配置:分别为kafka-cluster-kafka-config和kafka-cluster-zookeeper-config。Secretsto hold Cluster CA Certs to enable TLS encryption.持有群集CA证书以启用TLS加密的
Secrets。Servicesof typeloadbalancerone for each broker and one moreloadbalancertypeservicefor an external bootstrap service used to connect from outside the cluster.类型为
loadbalancerServices,每个代理一个,用于外部引导服务的另一个loadbalancer类型的service,用于从群集外部进行连接。Public IPsfor each of the brokers (3, one for each replica) are created and new front-end IP configurations are added to thekubernetesload balancer for our AKS cluster, essentially exposing the brokers outside the cluster. Let’s see the exposedservices创建每个代理的
Public IPs(3,每个副本一个),并将新的前端IP配置添加到我们的AKS集群的kubernetes负载均衡器中,从本质kubernetes代理暴露在集群之外。 让我们看看公开的services
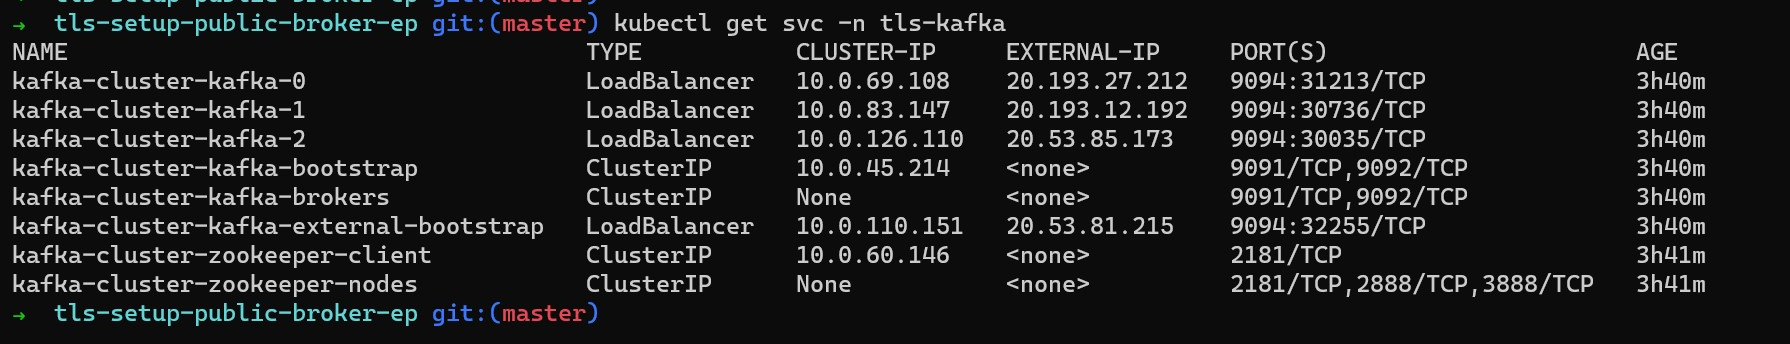
As you can see above, the Strimzi Cluster Operator also creates an external bootstrap service (in our case, its called kafka-cluster-kafka-external-bootstrap) which is used initially for bootstrapping but after that Kafka recommends connecting to brokers directly. The already existing kubernetes load balancer for your AKS cluster facilitates direct connectivity via multiple front-end public IP configurations. The target deployment architecture would be something on the lines of
从上面可以看到,Strimzi集群操作员还创建了一个外部引导服务(在我们的示例中,称为kafka-cluster-kafka-external-bootstrap ),该服务最初用于引导,但在此之后,Kafka建议直接连接到代理。 用于AKS集群的现有kubernetes负载均衡器可通过多个前端公共IP配置促进直接连接。 目标部署架构将是
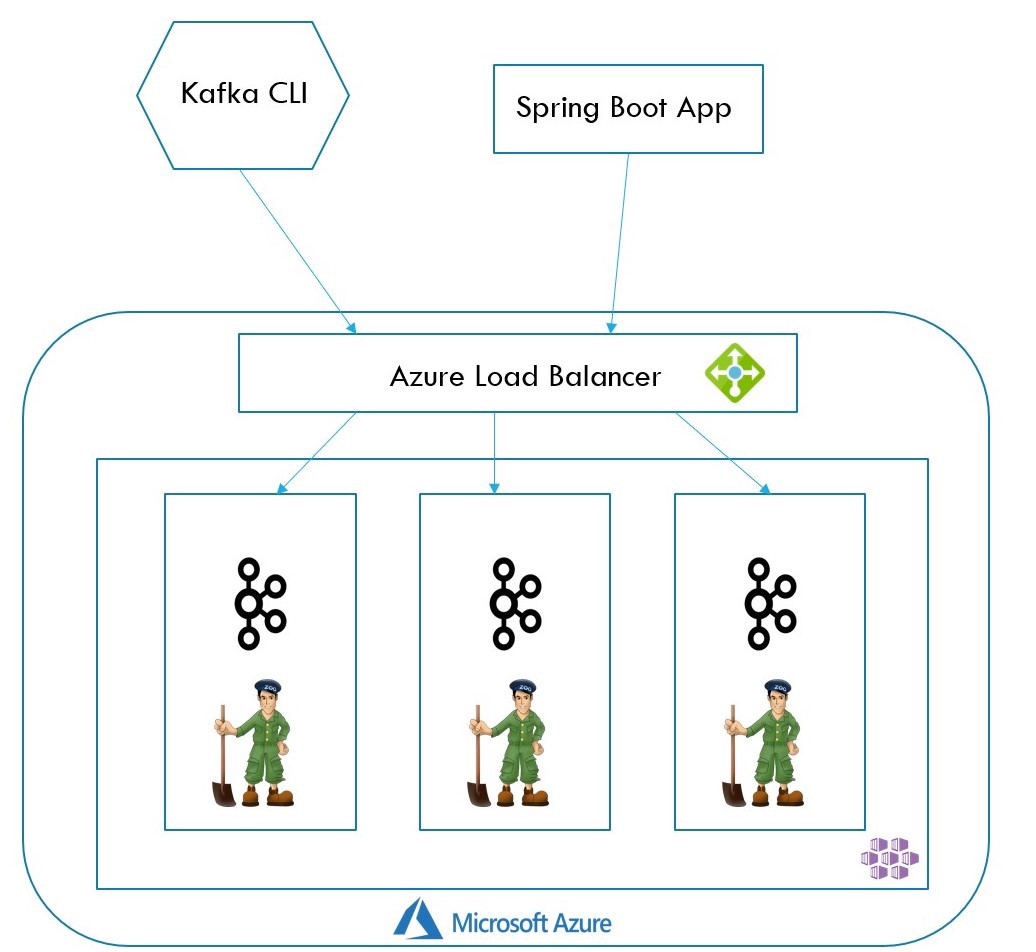
Note that in above image, the Load Balancer is not really an extra hop once the client applications know which broker to talk to. It is there to facilitate external communication from the AKS cluster and not really any load balancing.
请注意,在上图中,一旦客户端应用程序知道要与哪个代理进行通信,负载平衡器实际上并不是一个额外的跃点。 它在那里是为了促进来自AKS群集的外部通信,而不是真正的任何负载平衡。
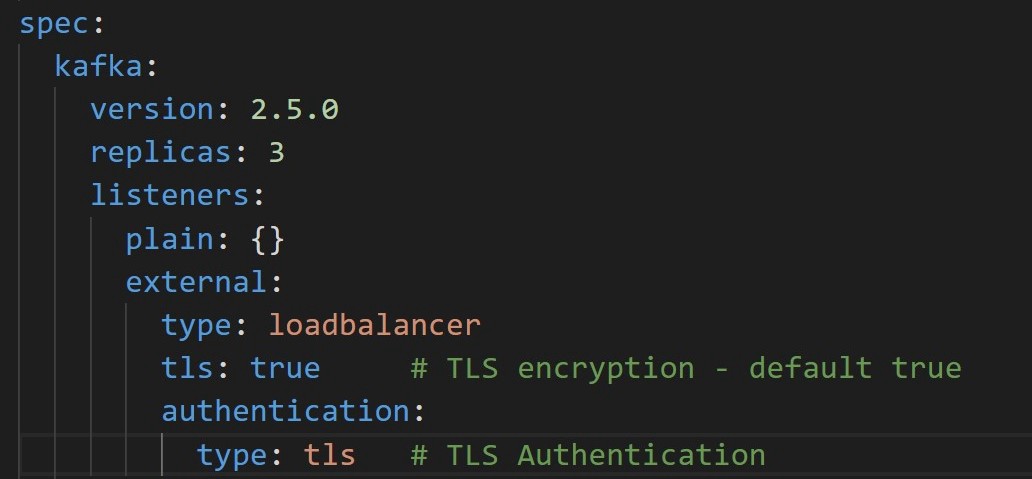
You are also free to configure multiple listeners for the same Kafka cluster, if that is what you desire. For example you can expose the Kafka cluster running on Kubernetes without any security (No TLS encryption & No AuthN & AuthZ) to internal applications (which are running in the same cluster) assuming you trust them, while enforcing TLS encryption & Authentication & Authorization (as we will see below) to applications running outside the cluster using both plain & external listeners on the same Kafka Custom Resource.
如果需要,您还可以为同一Kafka集群配置多个侦听器。 例如,假设您信任Kubernetes上运行的Kafka集群,而无需任何安全性(没有TLS加密&没有AuthN&AuthZ),则可以将它们公开给内部应用程序(在同一集群中运行),同时强制执行TLS加密&身份验证和授权(正如我们将在下面看到的)使用同一Kafka自定义资源上的plain侦听器和external侦听器,将其运行到在群集external运行的应用程序。
安全 (Security)
Let’s now drill down into each of the three 3 tenets of security:
现在让我们深入研究安全性的三个三个原则:
TLS Encryption for data exchange — This is enabled by default with
externallistener fortype: loadbalancerbut you can also setspec.kafka.listeners.external.tlsproperty totruemanually.用于数据交换的TLS加密—默认情况下,
external侦听type: loadbalancer启用以下type: loadbalancer但您也可以手动将spec.kafka.listeners.external.tls属性设置为true。Authentication — Strimzi supports TLS Auth, SCRAM-SHA and OAuth for authenticating against the kafka brokers. This is achieved by configuring both
KafkaandKafkaUserCustom Resources as we saw in the first blog entry & we’ll see an example below. For our use-case we use TLS Auth and for that we set the propertyspec.kafka.listeners.external.authentication.typetotls身份验证-Strimzi支持TLS身份验证,SCRAM-SHA和OAuth,以针对kafka代理进行身份验证。 这是通过配置第一个博客条目中看到的
Kafka和KafkaUser自定义资源来实现的,我们将在下面看到一个示例。 对于我们的用例,我们使用TLS身份验证,为此,我们将属性spec.kafka.listeners.external.authentication.type设置为tls
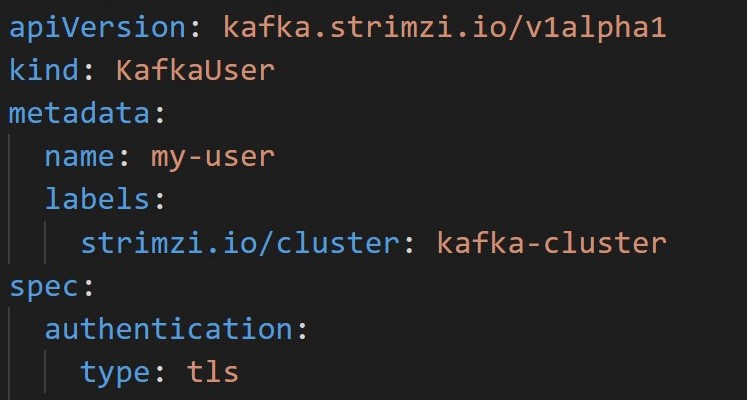
For the KafkaUser Custom Resource, we configure TLS Auth by setting the property spec.authentication.type to tls
对于KafkaUser自定义资源,我们通过将属性spec.authentication.type设置为tls来配置TLS spec.authentication.type验证
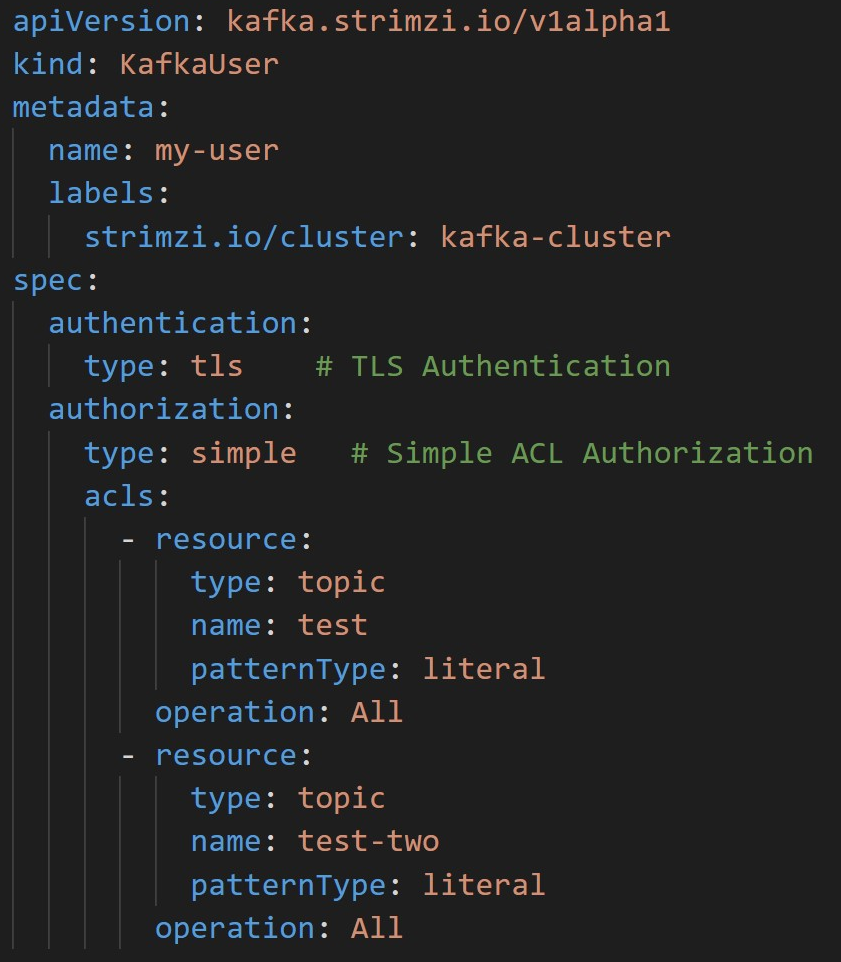
3. Authorization — Strimzi supports Simple ACL Authorization, OAuth2.0 based Authorization & Open Policy Agent(OPA) Authorization. Also for all these types, one can also define SuperUsers, who have complete access to all resources of the cluster. For this example we are using Simple ACL Authorization. This is configured in KafkaUser Custom Resource by setting the property spec.authorization.type to simple and defining appropriate ACLs for that user. In the example below, the user has full rights to topics test and test-two
3.授权-Strimzi支持简单ACL授权,基于OAuth2.0的授权和开放策略代理(OPA)授权。 同样对于所有这些类型,还可以定义SuperUsers ,他们可以完全访问集群的所有资源。 对于此示例,我们使用简单ACL授权。 通过将属性spec.authorization.type设置为simple并为该用户定义适当的ACL,可以在KafkaUser自定义资源中KafkaUser配置。 在下面的示例中,用户拥有主题test和test-two完整权限
As we saw in the first blog entry, both KafkaUser & KafkaTopic custom resources are tracked & managed by Entity Operator while any changes to Kafka is tracked & managed by Cluster Operator. Let’s proceed with creating some topics & users for our setup
正如我们在第一个博客条目中看到的那样, KafkaUser和KafkaTopic自定义资源均由Entity Operator跟踪和管理,而对Kafka任何更改均由Cluster Operator跟踪和管理。 让我们继续为设置创建一些主题和用户
# Topics: test & test-two
kubectl apply -f https://raw.githubusercontent.com/agrajm/strimzi-kafka-aks/master/tls-setup-public-broker-ep/kafka-topics.yaml# User with TLS AuthN & Simple ACL AuthZ
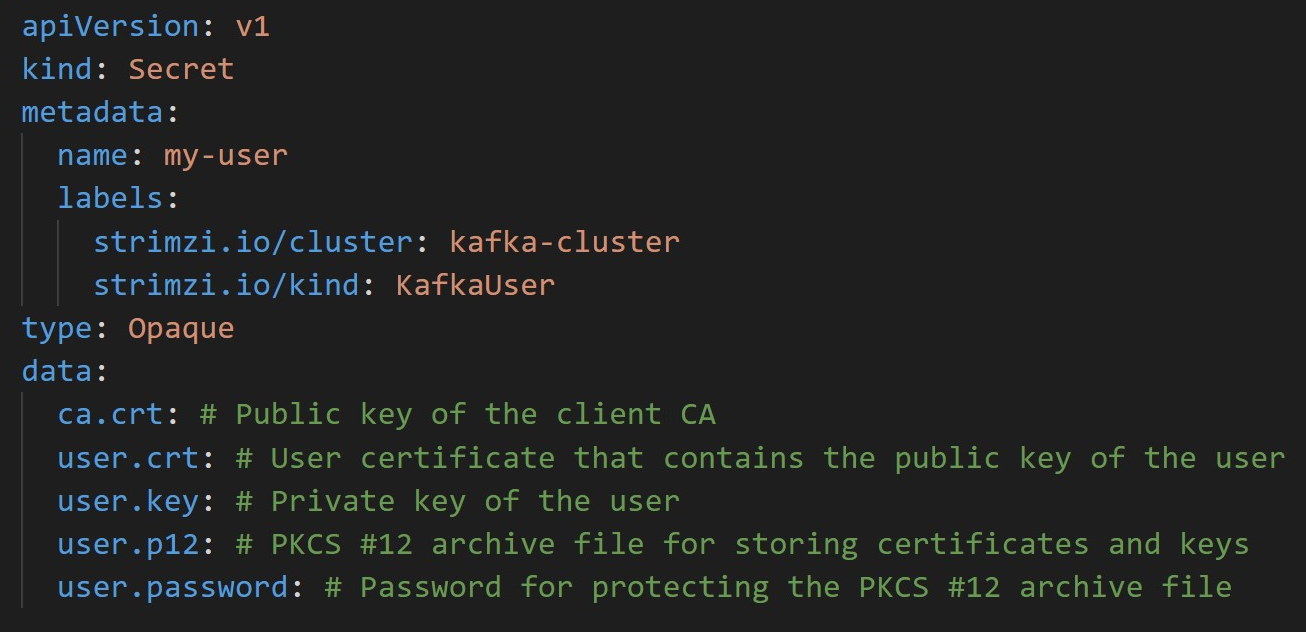
kubectl apply -f https://raw.githubusercontent.com/agrajm/strimzi-kafka-aks/master/tls-setup-public-broker-ep/kafka-users.yamlAs we apply these Custom Resources, the Entity Operator spring into action & create Topics & Users, but also creates Secret with the same name as that of KafkaUser — this secret contains a private and public key for TLS client authentication. The public key is contained in a user certificate, which is signed by the client Certificate Authority (CA). Let’s have a look
当我们将这些自定义资源,实体经营Spring行动和创建主题和用户,但也创造了Secret具有相同名称为的KafkaUser -这个秘密包含TLS客户端身份验证私钥和公钥。 公钥包含在用户证书中,该证书由客户端证书颁发机构(CA)签名。 我们来看一下
kubectl get secret my-user -n tls-kafka -o yamlThe my-user secret looks like
我的用户秘密看起来像
Kafka的相互TLS设置(Mutual TLS Setup for Kafka)
It’s a good idea to have a high level overview of how the 2 way mutual TLS authentication works for Kafka before start using these Secrets & Certificates to configure our TrustStore(s) & KeyStore(s).
在开始使用这些Secrets和Certificates来配置我们的TrustStore和KeyStore之前,最好先对Kafka的双向双向TLS身份验证如何工作有一个高层次的概述。
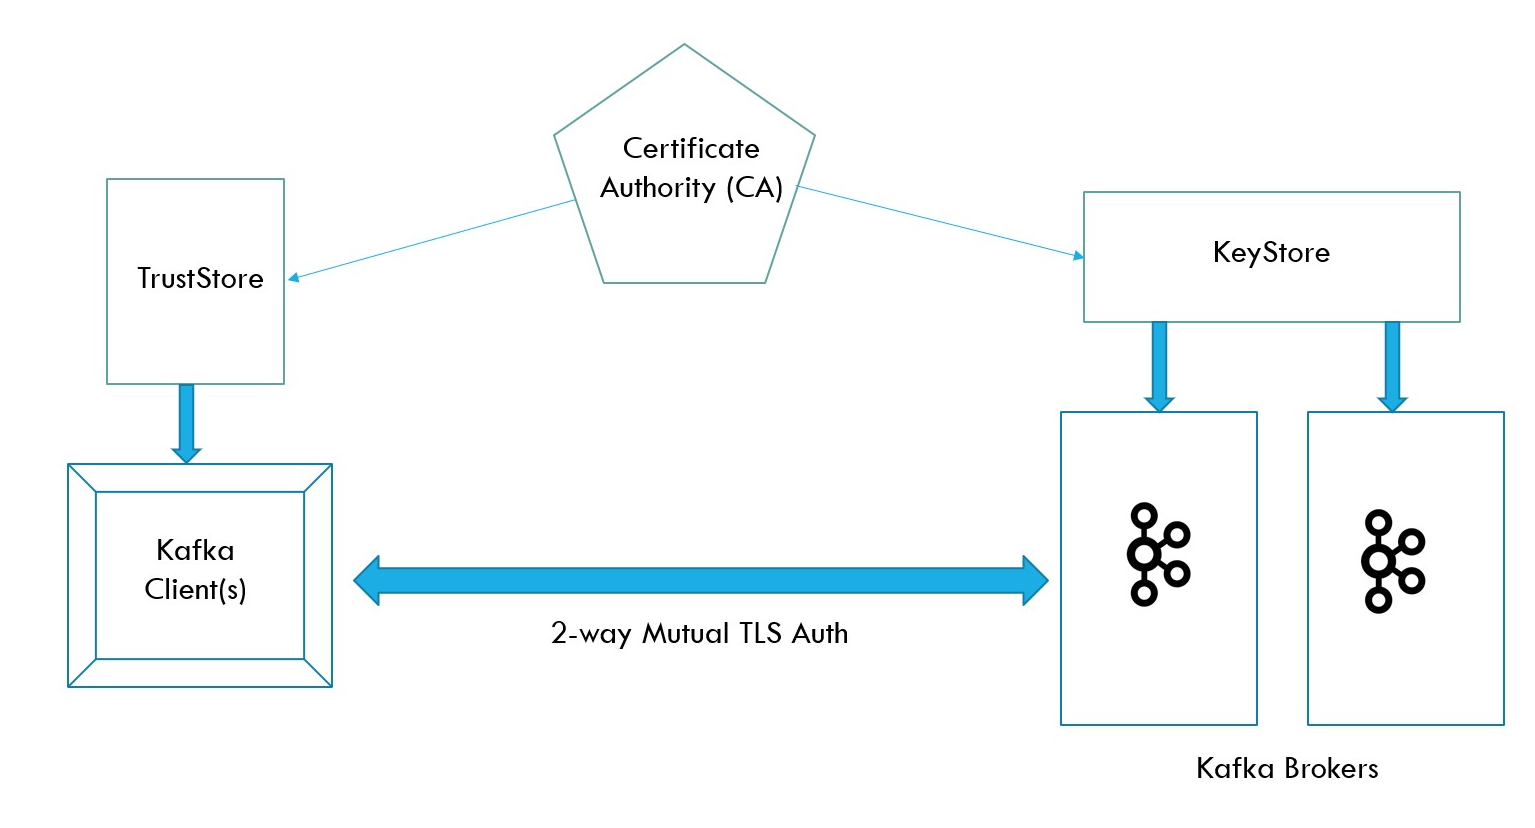
Since its a 2 way verification with Kafka Clients verifying the identity of Kafka Brokers and vice-versa — we need certificates! Certificates are signed by a Trusted Certificate Authority (CA) and issued to both Kafka Clients/Users and to Kafka Brokers, these certificates are used prove one’s identity. Creating the Certificate Authority and issuing & signing certificates is mostly automatic & taken care by the Strimzi Cluster & Entity Operators:
由于与Kafka客户进行了双向验证,因此可以验证Kafka Brokers的身份,反之亦然-我们需要证书! 证书由受信任的证书颁发机构(CA)签名,并颁发给Kafka客户/用户和Kafka经纪人,这些证书用于证明自己的身份。 Strimzi集群和实体运营商大多自动创建证书颁发机构并颁发和签署证书:
When we create a TLS encryption enabled
Kafkacluster, the Cluster Operator creates a secret that holds the Cluster CA Certificate, which can be imported into the Client’s TrustStore to verify the identity of the Kafka Brokers.当我们创建启用了TLS加密的
Kafka群集时,群集操作员会创建一个包含群集CA证书的机密,该证书可以导入到客户的TrustStore中以验证Kafka经纪人的身份。Similarly, when we create a
KafkaUserfor this cluster with TLS Authentication enabled, the User Operator (part of Entity Operator) creates the secret which holds the private key & certificate for the Kafka Client/User, which can be presented to the broker to verify the identity of the client.同样,当我们为启用了TLS身份验证的集群创建
KafkaUser时,用户操作员(实体操作员的一部分)会创建一个秘密,其中包含用于Kafka客户/用户的私钥和证书,可以将该秘密提供给代理以进行验证客户的身份。- This 2 way verification occurs during the SSL Handshake that happens when a client tries to establish the connection with the broker. 客户端尝试与代理建立连接时,会在SSL握手期间进行这种2种方式的验证。
We now only need to extract the certificates & keys from these Kubernetes Secrets and configure our truststores & keystores accordingly, as we’ll see in the next section.
现在,我们只需要从这些Kubernetes Secrets提取证书和密钥,并相应地配置我们的信任库和密钥库,正如我们将在下一部分中看到的那样。
And while we are at it, for those of us who have not configured SSL/TLS connections for a while, here is a quick one-line difference b/w a TrustStore and a KeyStore : → You use a TrustStore to store Trusted Certificates from, let’s say a Certificate Authority (CA). → You use a KeyStore to store your own private keys & certificates which can be presented to the other party to prove your identity.
在我们这样做的同时,对于我们一段时间未配置SSL / TLS连接的人来说,b / wa TrustStore和KeyStore有一个快速的单线区别:→您使用TrustStore来存储来自以下位置的可信证书:假设是一个认证中心(CA)。 →您使用KeyStore来存储自己的私钥和证书,这些私钥和证书可以提供给另一方以证明您的身份。
建立生产者和消费者 (Setting up Producers & Consumers)
Now that we have the required infrastructure in place & with the above picture in mind, let’s configure the SSL/TLS setup:
现在我们已经准备好了所需的基础结构,并牢记了上面的图片,让我们配置SSL / TLS设置:
Import Cluster CA Cert into Kafka Client’s TrustStore — since we are testing with Kafka CLI tools so we need to import these into our JDK’s truststore using
keytoolcommand.将群集CA证书导入到Kafka客户的TrustStore中-由于我们正在使用Kafka CLI工具进行测试,因此我们需要使用
keytool命令将其导入到JDK的truststore中。
First we’ll extract & decode the ca.crt & ca.password from our Kubernetes Secret (kafka-cluster-cluster-ca-cert) containing the Cluster CA Cert into 2 files:
首先,我们将从包含集群CA证书的Kubernetes Secret (kafka-cluster-cluster-ca-cert)中提取ca.crt和ca.password解码为2个文件:
kubectl get secret kafka-cluster-cluster-ca-cert -o jsonpath='{.data.ca\.crt}' | base64 --decode > ca.crtkubectl get secret kafka-cluster-cluster-ca-cert -o jsonpath='{.data.ca\.password}' | base64 --decode > ca.passwordNow, we actually import these into our JDK’s truststore — which is typically the cacerts file in your Java installation. Run the following command to import the above certificate into cacerts
现在,我们实际上将它们导入到JDK的信任库中,该信任库通常是Java安装中的cacerts文件。 运行以下命令以将上述证书导入cacerts
$ export KEY_PASSWORD=$(cat ca.password)
$ sudo keytool -importcert -alias strimzi-kafka-cluster-ca-cert -cacerts -file ca.crt -keypass $KEY_PASSWORD -storepass changeit
Using keytool we can import certificates into the default truststore cacerts and the above command uses the default password for the truststore: changeit but make sure to use your truststore specific settings here.
使用keytool我们可以将证书导入默认的信任库cacerts ,并且以上命令使用信任库的默认密码: changeit但请确保在此处使用特定于信任库的设置。
2. Import the Kafka User’s private key & certificate into Client’s KeyStore — so that when the Kafka Client initiates the SSL Handshake
2.将Kafka用户的私钥和证书导入到客户端的KeyStore中-这样,当Kafka客户端启动SSL握手时
Similar to the first step, we will first extract the keys & certificates from my-user kubernetes secret & decode them using base64
与第一步类似,我们将首先从my-user kubernetes秘密中提取密钥和证书,并使用base64对其进行解码
$ kubectl get secret my-user -o jsonpath='{.data.user\.crt}' | base64 --decode > user.crt
$ kubectl get secret my-user -o jsonpath='{.data.user\.key}' | base64 --decode > user.key
$ kubectl get secret my-user -o jsonpath='{.data.user\.p12}' | base64 --decode > user.p12
$ kubectl get secret my-user -o jsonpath='{.data.user\.password}' | base64 --decode > user.password
Now we have to create a keystore (kafka-client-auth.jks) using keytool
现在我们必须使用keytool创建一个密钥库(kafka-client-auth.jks)
$ export USER_PASSWORD=$(cat user.password)
$ sudo keytool -importkeystore -deststorepass changeme -destkeystore kafka-client-auth.jks -srckeystore user.p12 -srcstorepass $USER_PASSWORD -srcstoretype PKCS12
Note that we have used changeme as the destination keystore password. We will use this in our SSL config file later on
请注意,我们已将changeme用作目标密钥库密码。 稍后,我们将在SSL配置文件中使用它

3. Creating the SSL Config File
3.创建SSL配置文件
Finally we gather all the information in the SSL Config properties file that will be used with Kafka CLI producers & consumers
最后,我们在SSL Config属性文件中收集所有信息,该文件将与Kafka CLI生产者和消费者一起使用
bootstrap.servers=<Public_IP_External_Bootstrap_Service>:9094
security.protocol=SSL
ssl.truststore.location=<LOCATION_OF_YOUR_CACERTS>
ssl.truststore.password=changeit
ssl.keystore.location=kafka-client-auth.jks
ssl.keystore.password=changeme
ssl.key.password=dwCx9dSCvstS
Finally fire up your Producers & Consumers and use this file as config
最后启动您的生产者和消费者,并将此文件用作配置
Kafka CLI生产者(Kafka CLI Producer)
$KAFKA_HOME/bin/kafka-console-producer.sh --broker-list 20.53.81.215:9094 --topic test --producer.config client-ssl.propertiesKafka CLI使用者 (Kafka CLI Consumer)
$KAFKA_HOME/bin/kafka-console-consumer.sh --bootstrap-server 20.53.81.215:9094 --topic test --consumer.config client-ssl.properties --from-beginningAnd this is it ! We are able to connect successfully and perform SSL Authentication & TLS encryption with the Kafka brokers.
就是这样! 我们能够成功连接并与Kafka代理进行SSL身份验证和TLS加密。
用于监视Kafka的Azure Monitor (Azure Monitor for Monitoring Kafka)
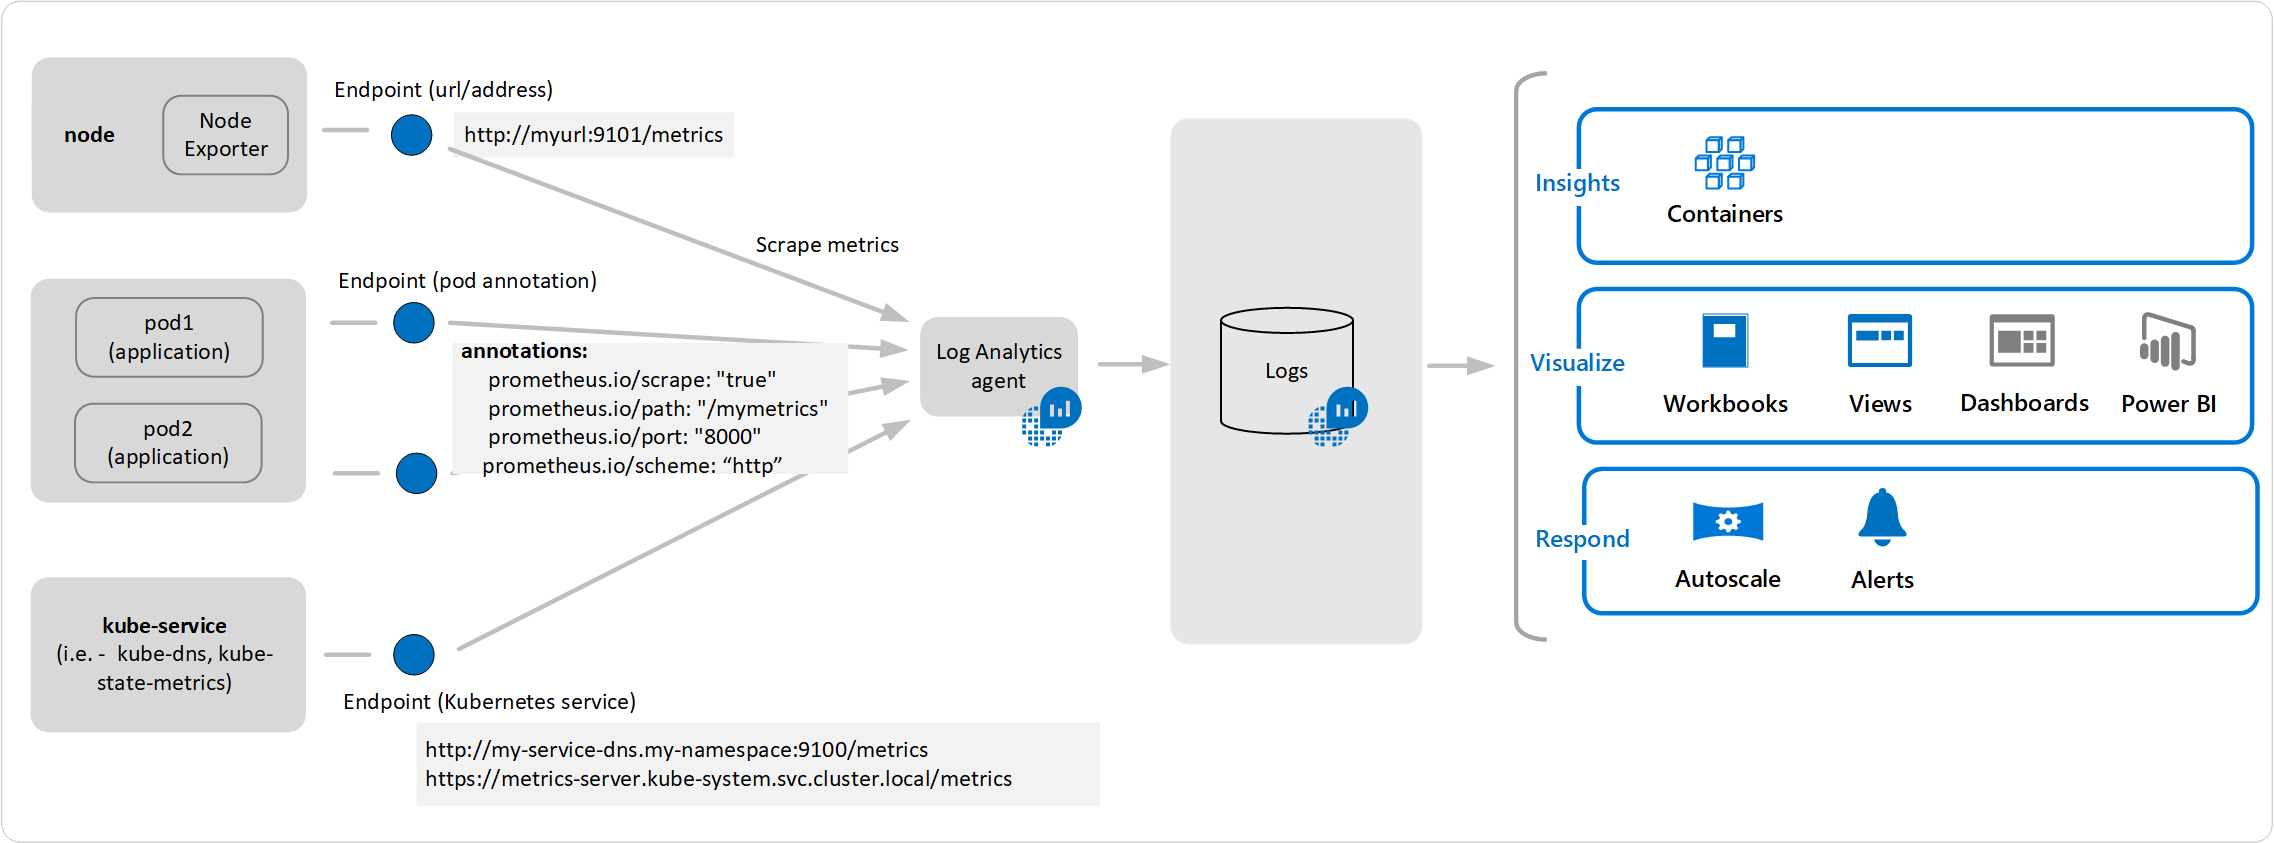
In this section, we will explore how we can setup Monitoring for our Kafka cluster running on AKS using Azure Monitor. As you might know, Azure Monitor Log Analytics agent is now capable to scraping Prometheus metrics from pods & nodes without having to install & manage Prometheus server & databases. The Log Analytics Agent is capable of capturing prometheus metrics from:
在本节中,我们将探索如何使用Azure Monitor为运行在AKS上的Kafka群集设置监视。 如您所知, Azure Monitor Log Analytics代理现在能够从Pod和节点中抓取Prometheus指标,而无需安装和管理Prometheus服务器和数据库。 Log Analytics Agent能够从以下位置捕获Prometheus指标:
Kubernetes Services like
kube-dns&kube-state-metricsor your own.Kubernetes服务,例如
kube-dns和kube-state-metrics或您自己的。- Any HTTP/HTTPS based URLs across your cluster. 集群中所有基于HTTP / HTTPS的URL。
- Any Pods or Metrics Exporters that you may be using — these will need to be annotated properly using 您可能使用的所有Pod或Metrics导出程序-需要使用以下方法正确注释这些
The config for Log Analytics Agent is typically configured in a global configmap — for your AKS Cluster this is not present by default. So you would need to download this ConfigMap template from Github & make changes accordingly (as we will see later in the post).
Log Analytics Agent的配置通常在全局配置图中配置-对于AKS群集,默认情况下不存在。 因此,您需要从Github下载此ConfigMap模板并进行相应的更改(我们将在后文中看到)。
For Kafka Workloads, we also will make use of Kafka Exporter to provide with additional metrics for Brokers, Topics & Consumer Groups, offsets, consumer lag etc. Strimzi comes in handy here as well and provides an easy way to enable Kafka Exporter:
对于Kafka工作负载,我们还将利用Kafka Exporter为经纪人,主题和消费者组,抵消,消费者滞后等提供其他指标。Strimzi在这里也派上用场,并提供了一种启用Kafka Exporter的简便方法:
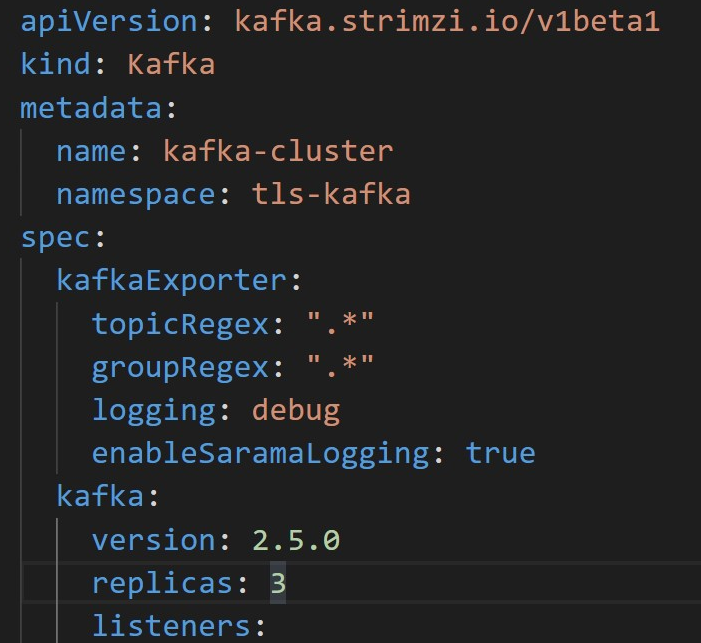
Above snippet shows how you can configure Kafka Exporter directly in your Kafka resource. Check the Strimzi docs for the schema for the exporter. Create a new Kafka cluster with metrics or modify your existing Kafka Cluster with metrics info.
上面的代码片段显示了如何直接在Kafka资源中配置Kafka Exporter。 在Strimzi文档中查看导出器的架构。 使用指标创建新的Kafka群集,或使用指标信息修改现有的Kafka群集。
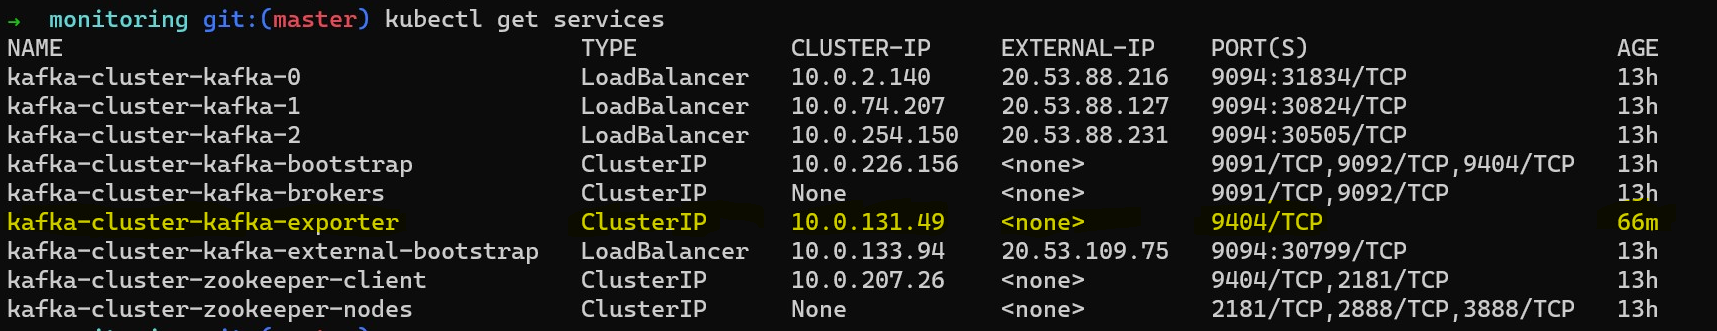
kubectl apply -f https://raw.githubusercontent.com/agrajm/strimzi-kafka-aks/master/tls-setup-public-broker-ep/monitoring/kafka-cluster-metrics.yaml This creates an additional pod & service for Kafka Exporter.
这将为Kafka Exporter创建一个附加的pod和服务。
You can see the raw Prometheus Metrics data by running the following command:
您可以通过运行以下命令来查看原始的Prometheus指标数据:
$ kubectl run debug-curl --rm -i --tty --restart=Never --image=radial/busyboxplus:curl -- curl "http://kafka-cluster-kafka-exporter.tls-kafka.svc.cluster.local:9404/metrics"Here we use a busybox pod & curl to the above Kafka Exporter Service’ metrics endpoint to see the raw Prometheus metrics.
在这里,我们使用busybox pod&curl到上述Kafka Exporter Service的度量标准端点,以查看原始的Prometheus度量标准。
We will now configure our Azure Monitor Configmap template (which we downloaded already) to scrap Prometheus metrics from this kafka-cluster-kafka-exporter service. Search for kubernetes_services in the configmap under the section [prometheus_data_collection_settings.cluster] and uncomment the service and specify your own Kafka Exporter service
现在,我们将配置我们的Azure Monitor Configmap模板(已下载),以从此kafka-cluster-kafka-exporter服务中删除Prometheus指标。 在[prometheus_data_collection_settings.cluster]部分下的kubernetes_services中搜索kubernetes_services ,然后取消对该服务的注释,并指定您自己的Kafka Exporter服务
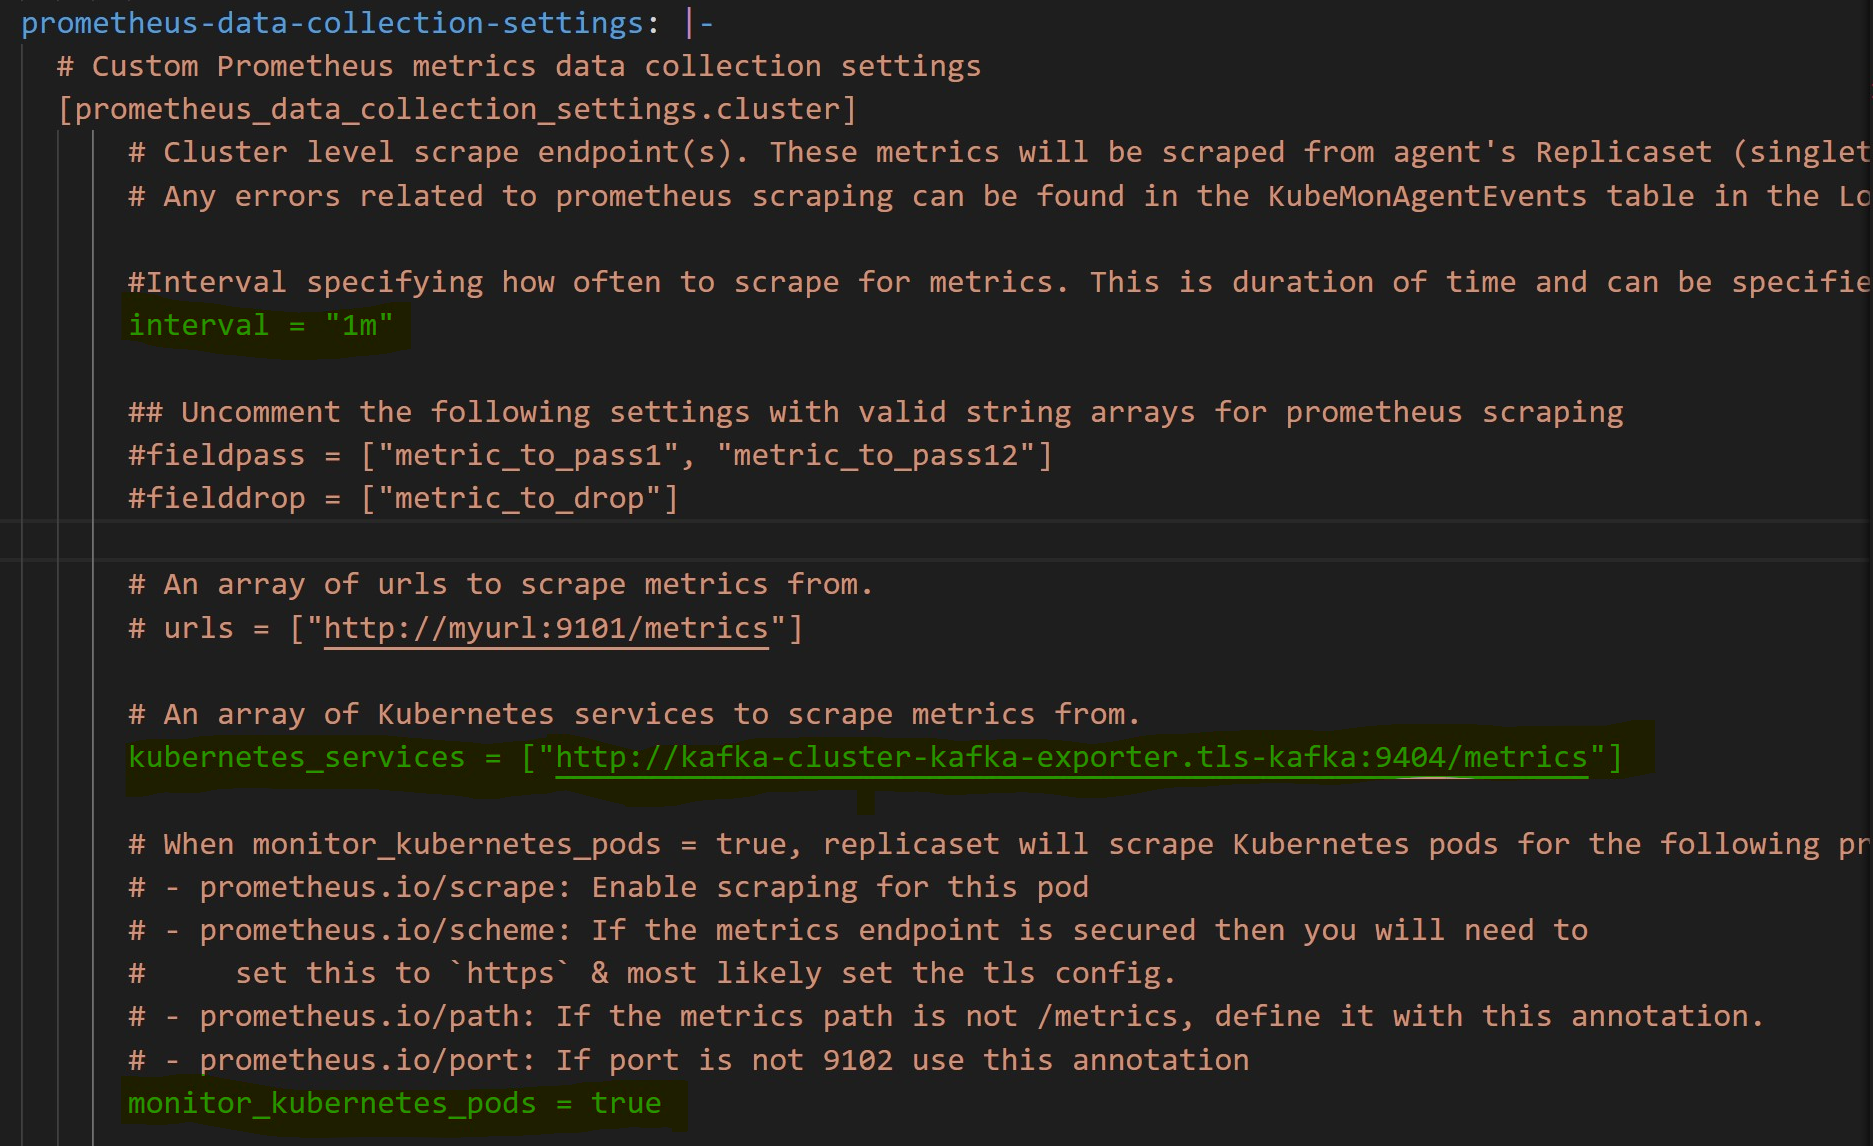
I have highlighted the important sections
我强调了重要的部分
Although the default interval is 1m, you can configure this in
nanosecondsµsecondsif that is what you desire.尽管默认间隔为1m,但如果需要,您可以以
nanoseconds和microseconds进行配置。- You can monitor individual pods instead of services but then you would need to annotate those pods with prometheus specific annotations. 您可以监视单个Pod而不是服务,但是随后需要使用Prometheus特定的注释对这些Pod进行注释。
Importantly for our use-case we modified the
kubernetes_servicesarray to point to our Kafka Exporter services — note thetls-kafkanamespace after the service name.重要的是,对于我们的用例,我们修改了
kubernetes_services数组以指向我们的Kafka Exporter服务-注意服务名称后的tls-kafka命名空间。The configmap also allows you to filter the metrics to pass through by specifying
fieldpass&fielddropin case you are concerned about the amount of logs & cost it can aggregate to.configmap还允许您通过指定
fieldpass和fielddrop来过滤要通过的指标,以防万一您担心它可以聚合的日志量和成本。- Its worth mentioning again, this is a global Configmap — you only need 1 Configmap per AKS cluster so if this cluster is being shared by multiple teams, they would need to share this configmap as well. 再次值得一提的是,这是一个全局的Configmap-每个AKS群集仅需要1个Configmap,因此,如果多个团队共享此群集,则他们也需要共享此Configmap。
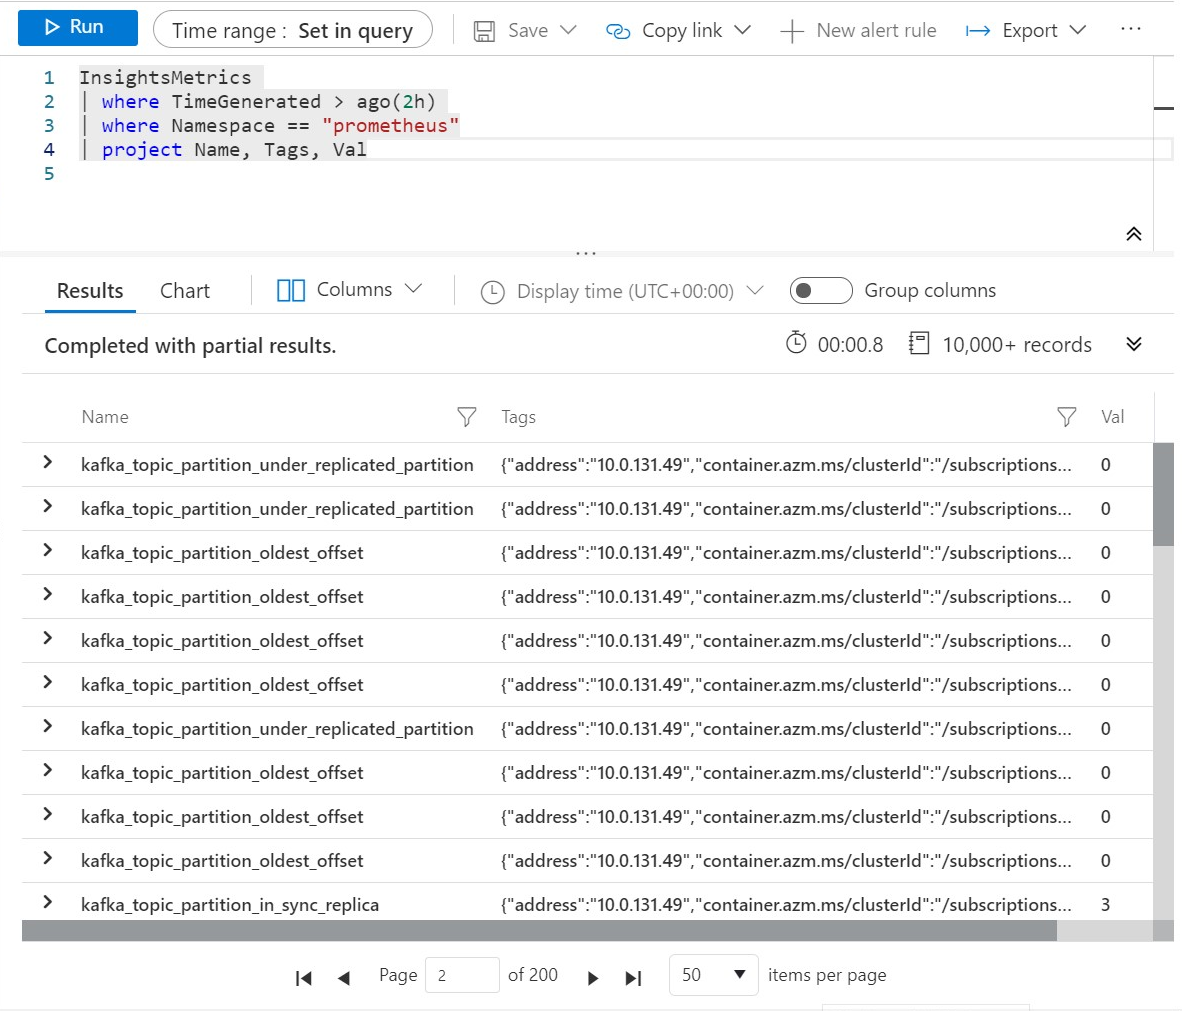
$ kubectl apply -f https://raw.githubusercontent.com/agrajm/strimzi-kafka-aks/master/tls-setup-public-broker-ep/monitoring/container-azm-ms-agentconfig.yaml That’s all you need to configure the Azure Monitor Log Analytics Agent / OMS Agent to scrape the prometheus metrics collected by the Kafka Exporter — these are now available in Log Analytics Workspace where you can query and create alerts based on these metrics. These metrics are available in InsightMetrics table and in prometheus namespace. You can use the following query to see the data collected in the last couple of
这就是配置Azure Monitor Log Analytics代理/ OMS代理以刮除Kafka Exporter收集的prometheus度量标准所需的全部操作-这些现在可在Log Analytics Workspace中使用,您可以在其中查询和创建基于这些度量标准的警报。 这些指标可在InsightMetrics表和prometheus命名空间中找到。 您可以使用以下查询来查看最后两个查询中收集的数据
InsightsMetrics
| where TimeGenerated > ago(2h)
| where Namespace == "prometheus"
| project Name, Tags, Val
which shows us various metrics & their values.
向我们展示了各种指标及其价值。
It should be noted that Prometheus takes a flat approach to naming metrics instead of hierarchical, dot-separated notion, it uses a series of tags & labels on the metrics. For example to specify In-sync replica for a specific partition in a particular topic, Prometheus metric would be like
应当指出,Prometheus采用一种扁平的方式来命名度量,而不是使用分层的,点分隔的概念,它在度量上使用了一系列标记和标签。 例如,为特定主题中的特定分区指定同步副本,Prometheus指标将类似于
kafka_topic_partition_in_sync_replica{partition="3",topic="test"} 3This will be converted to Name & Tags in the InsightsMetrics table in Log Analytics. It will be stored as following:
这将在Log Analytics的InsightsMetrics表中转换为“ Name和Tags ”。 它将存储如下:
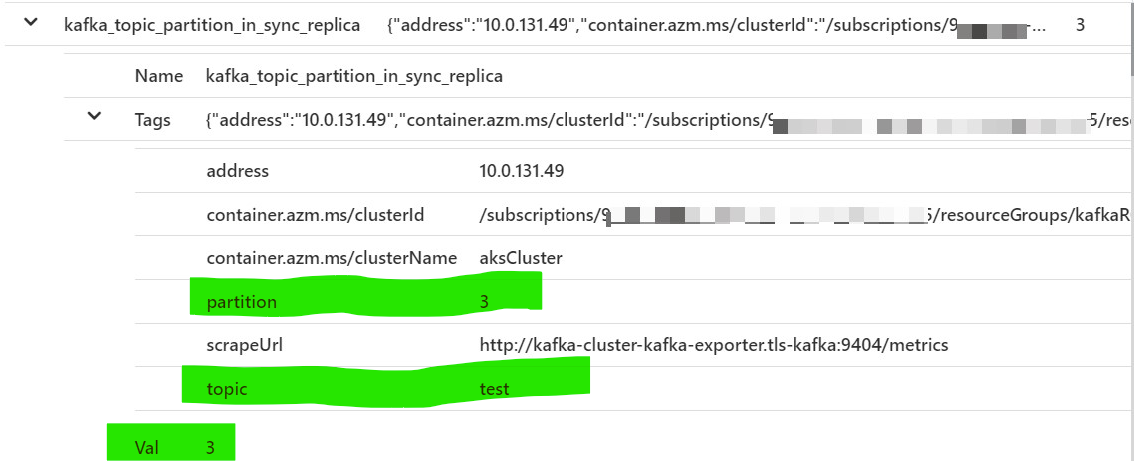
Therefore, you may need to tweak your queries accordingly.
因此,您可能需要相应地调整查询。
Now that you have all the metrics in Log Analytics, you can use the standard features of Azure Monitor to create Alerts based on metrics & notify based on action groups.
既然您已经在Log Analytics中拥有所有指标,则可以使用Azure Monitor的标准功能来基于指标创建警报并基于操作组进行通知。
This brings us to an end of a rather lengthy blog post, hope you enjoyed it and learned something new !
这使我们结束了一篇冗长的博客文章,希望您喜欢它并学到新知识!
翻译自: https://medium.com/swlh/kafka-on-azure-kubernetes-service-part-2-a837889ecadc


 被折叠的 条评论
为什么被折叠?
被折叠的 条评论
为什么被折叠?
 到【灌水乐园】发言


